Unlock a world of possibilities! Login now and discover the exclusive benefits awaiting you.
- Qlik Community
- :
- All Forums
- :
- QlikView App Dev
- :
- Line chart with 2 expression display like Comparat...
- Subscribe to RSS Feed
- Mark Topic as New
- Mark Topic as Read
- Float this Topic for Current User
- Bookmark
- Subscribe
- Mute
- Printer Friendly Page
- Mark as New
- Bookmark
- Subscribe
- Mute
- Subscribe to RSS Feed
- Permalink
- Report Inappropriate Content
Line chart with 2 expression display like Comparative Analysis
Hello All,
I am having a requirement to show selection of 2 value from one dimension in one line graph like we do in Comparative Analysis. However, in my case it is will in one graph. Attach is the data and application for help.
Example:
I have LOB as selection dimension,date as my chart dimension and sum of GWP will be my expression. I need 3 buttons to be created for this scenario, one would be for X Axis and second will be for Y axis and third would be to clear the selection. When i select Motor from LOB field and then will click on X Axis button, it would freeze the data. After that I will select Health from LOB field, then click on Y Axis button. This selection will populated the data on the chart.
After following above step, my chart will have 2 data point, one would be for Motor and second would be for Health,
Hope it clarify my requirement.
Regards,
Imran Khan !
Accepted Solutions
- Mark as New
- Bookmark
- Subscribe
- Mute
- Subscribe to RSS Feed
- Permalink
- Report Inappropriate Content
Attaching solution for other community people !
- Mark as New
- Bookmark
- Subscribe
- Mute
- Subscribe to RSS Feed
- Permalink
- Report Inappropriate Content
Use the help of calculated condition make equations for all the LOB's
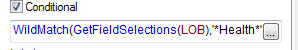
WildMatch(GetFieldSelections(LOB),'*Health*')>0
Same for all the values in LOB in Equation. Then you can select the list box to get the required output.
- Mark as New
- Bookmark
- Subscribe
- Mute
- Subscribe to RSS Feed
- Permalink
- Report Inappropriate Content
Hi Rupam,
I wanted it dinamic. Anyways I have found a solution.
Thanks
Imran Khan
- Mark as New
- Bookmark
- Subscribe
- Mute
- Subscribe to RSS Feed
- Permalink
- Report Inappropriate Content
Maybe then you can close the discussion
- Mark as New
- Bookmark
- Subscribe
- Mute
- Subscribe to RSS Feed
- Permalink
- Report Inappropriate Content
Attaching solution for other community people !