Unlock a world of possibilities! Login now and discover the exclusive benefits awaiting you.
Announcements
Qlik Open Lakehouse is Now Generally Available! Discover the key highlights and partner resources here.
- Qlik Community
- :
- All Forums
- :
- QlikView App Dev
- :
- Line chart with two dimensions in one
Options
- Subscribe to RSS Feed
- Mark Topic as New
- Mark Topic as Read
- Float this Topic for Current User
- Bookmark
- Subscribe
- Mute
- Printer Friendly Page
Turn on suggestions
Auto-suggest helps you quickly narrow down your search results by suggesting possible matches as you type.
Showing results for
Partner - Creator II
2015-06-30
11:06 AM
- Mark as New
- Bookmark
- Subscribe
- Mute
- Subscribe to RSS Feed
- Permalink
- Report Inappropriate Content
Line chart with two dimensions in one
Dear All,
I am trying to create a plot similar to the one displayed below, but with two lines. On the x axis, I would like to have one single dimension, representing the time of the day (in hours, from 0 to 23).
The aim of the plot is to show the number of people who arrive to the hospital by hour, and the number of people who leave the hospital by hour. One line for each.
So, should I have one single dimension for both, or separated dimensions?
Any ideas?
Thanks in advance.
Cheers,
Ines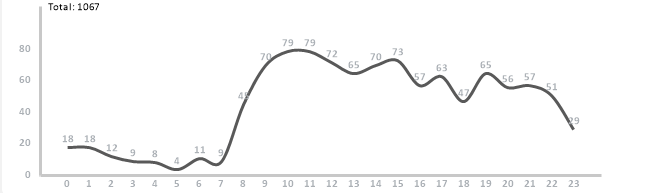
2,853 Views
- « Previous Replies
-
- 1
- 2
- Next Replies »
10 Replies
MVP
2015-06-30
02:02 PM
- Mark as New
- Bookmark
- Subscribe
- Mute
- Subscribe to RSS Feed
- Permalink
- Report Inappropriate Content
glad it helped
regards
Marco
222 Views
- « Previous Replies
-
- 1
- 2
- Next Replies »