Unlock a world of possibilities! Login now and discover the exclusive benefits awaiting you.
- Qlik Community
- :
- All Forums
- :
- QlikView App Dev
- :
- Line reference on stacked bar graph
- Subscribe to RSS Feed
- Mark Topic as New
- Mark Topic as Read
- Float this Topic for Current User
- Bookmark
- Subscribe
- Mute
- Printer Friendly Page
- Mark as New
- Bookmark
- Subscribe
- Mute
- Subscribe to RSS Feed
- Permalink
- Report Inappropriate Content
Line reference on stacked bar graph
Hi everyone,
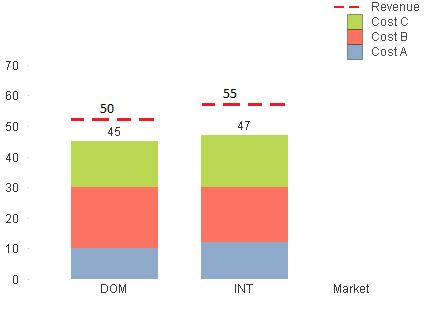
I really hope you can help me, basically I have a stacked bar and I want to show a reference line (it has to be a line) per each dimension value as I'm showing in the graph but still can't figure out how. Qlik can do this very easy but not with lines. I'm attaching the qvw of how it works naturally with Qlik and how I want it. If I can't do it naturally in Qlik, do you guys have any recommendations? an extension maybe?
Thank you very much 
Accepted Solutions
- Mark as New
- Bookmark
- Subscribe
- Mute
- Subscribe to RSS Feed
- Permalink
- Report Inappropriate Content
- Mark as New
- Bookmark
- Subscribe
- Mute
- Subscribe to RSS Feed
- Permalink
- Report Inappropriate Content
Hi,
Try

Thanks,
AS
- Mark as New
- Bookmark
- Subscribe
- Mute
- Subscribe to RSS Feed
- Permalink
- Report Inappropriate Content
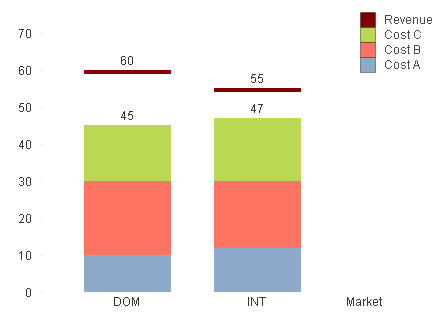
Reference lines apply to the whole chart rather than a single dimension value. You might be better off using a symbol plot for the revenue (convert to combo chart if necessary), or add another bar to the stack to get to the revenue number (revenue less the sum of the costs). You could make the bar very distinctive to distinguish between cost and profit.
- Mark as New
- Bookmark
- Subscribe
- Mute
- Subscribe to RSS Feed
- Permalink
- Report Inappropriate Content
Hi,
You can use trend lines,
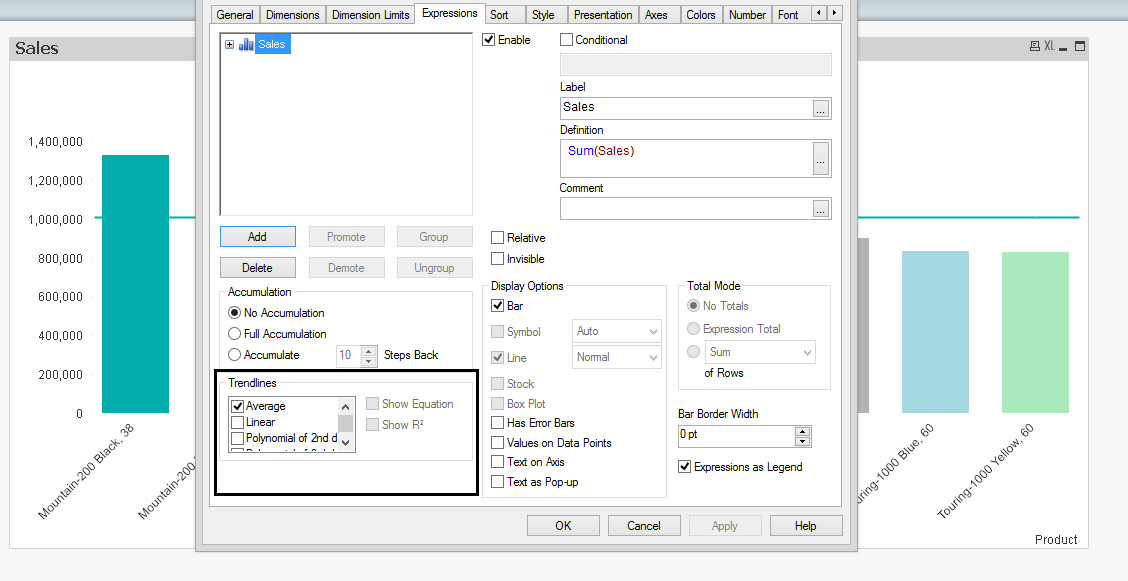
- For creating a ready and Calculated Values ,
- By selecting them you can get what you desired Line passing your Bars.
Else,
- If you have Revenue field you can go with Values list and Create a expression for revenue and use it in Bar Chart.
HTH,
Hirish
- Mark as New
- Bookmark
- Subscribe
- Mute
- Subscribe to RSS Feed
- Permalink
- Report Inappropriate Content
Hi Viridiana,
I think this would do it:
See attachment.
- Mark as New
- Bookmark
- Subscribe
- Mute
- Subscribe to RSS Feed
- Permalink
- Report Inappropriate Content
Perfect!!! Thank you very much
- Mark as New
- Bookmark
- Subscribe
- Mute
- Subscribe to RSS Feed
- Permalink
- Report Inappropriate Content
Thank you Amit, I tried this before but as Jonathan said "reference lines apply to the whole chart rather than a single dimension value". I think I got the solution I needed but I really appreciate you took the time to reply 😃 Thanks