Unlock a world of possibilities! Login now and discover the exclusive benefits awaiting you.
Announcements
April 13–15 - Dare to Unleash a New Professional You at Qlik Connect 2026: Register Now!
- Qlik Community
- :
- All Forums
- :
- QlikView App Dev
- :
- Linear Issue in Line Chart
Options
- Subscribe to RSS Feed
- Mark Topic as New
- Mark Topic as Read
- Float this Topic for Current User
- Bookmark
- Subscribe
- Mute
- Printer Friendly Page
Turn on suggestions
Auto-suggest helps you quickly narrow down your search results by suggesting possible matches as you type.
Showing results for
Creator II
2017-07-03
07:10 AM
- Mark as New
- Bookmark
- Subscribe
- Mute
- Subscribe to RSS Feed
- Permalink
- Report Inappropriate Content
Linear Issue in Line Chart
Hi All,
I have a line chart , where I need to show One Avg and respective Linear trend line.
Currently it is coming like this:
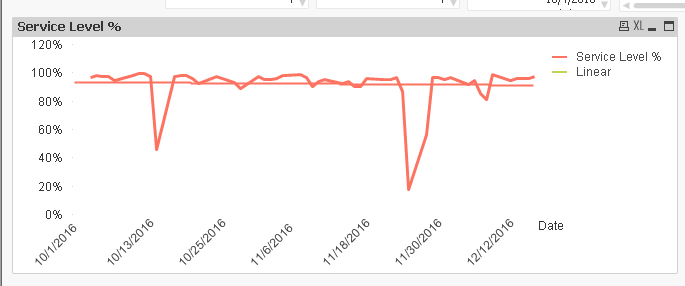
I want to show them in different color. Can we do this in front end without using linear_m and linear_b function.
I am attaching my sample App.
Please help.
Thanks,
Sarif
474 Views
3 Replies
Partner Ambassador/MVP
2017-07-03
07:28 AM
- Mark as New
- Bookmark
- Subscribe
- Mute
- Subscribe to RSS Feed
- Permalink
- Report Inappropriate Content
Hi,
Have a look at the application Attached.
Regards,
Kaushik Solanki
Please remember to hit the 'Like' button and for helpful answers and resolutions, click on the 'Accept As Solution' button. Cheers!
Creator II
2017-07-03
08:20 AM
Author
- Mark as New
- Bookmark
- Subscribe
- Mute
- Subscribe to RSS Feed
- Permalink
- Report Inappropriate Content
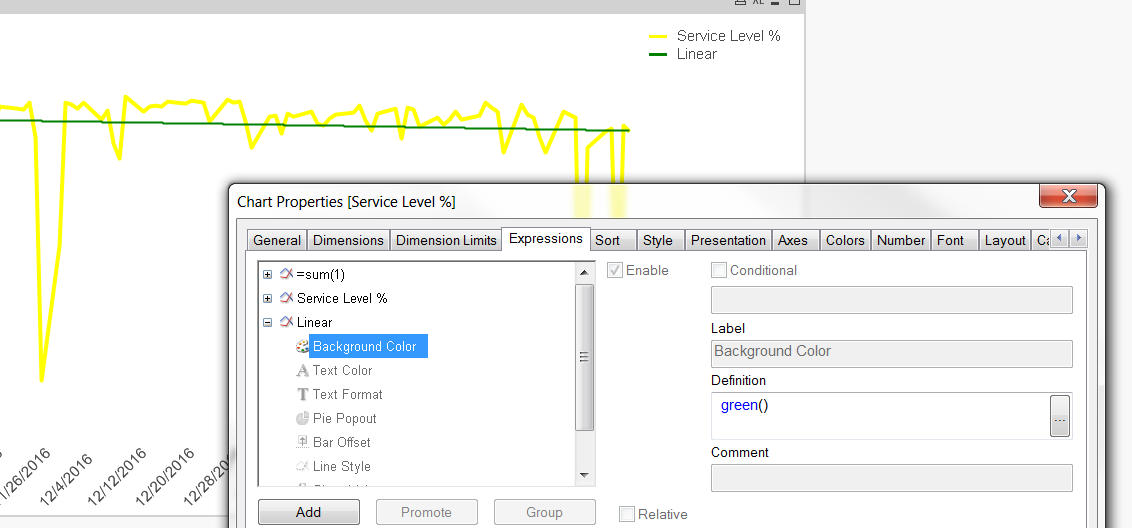
Hi Kaushik,
The Linear line showing in Green but the legend for Linear in in Blue.
Any way to rectify this?
Please help.
Thanks,
Sarif
365 Views
Master II
2017-07-07
03:58 AM
- Mark as New
- Bookmark
- Subscribe
- Mute
- Subscribe to RSS Feed
- Permalink
- Report Inappropriate Content
365 Views