Unlock a world of possibilities! Login now and discover the exclusive benefits awaiting you.
- Qlik Community
- :
- All Forums
- :
- QlikView App Dev
- :
- Linear line on Scatter Chart but define the slope ...
- Subscribe to RSS Feed
- Mark Topic as New
- Mark Topic as Read
- Float this Topic for Current User
- Bookmark
- Subscribe
- Mute
- Printer Friendly Page
- Mark as New
- Bookmark
- Subscribe
- Mute
- Subscribe to RSS Feed
- Permalink
- Report Inappropriate Content
Linear line on Scatter Chart but define the slope and y-intercept
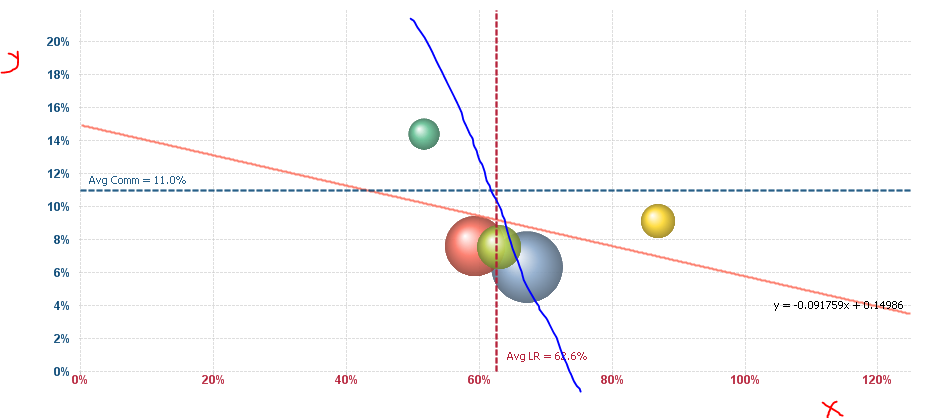
Is there a way to plot a linear reference line on a scatter chart where I can define the slope (m) and intercept (b) using the line equation y = mx + b? See the screenshot below of my chart in QV. I've added a linear trendline expression (the red line), but the equation shown isn't quite what I'm looking for. I need something like the blue line that I've drawn in. This line needs to cross where the averages of x and y meet and have a slope m = -1. I've tried playing around with adding a third reference line, but I can't seem to get anything but perfectly horizontal or vertical lines.
PS. I only have QV PE here at work, so please don't attach examples in qvw.