Unlock a world of possibilities! Login now and discover the exclusive benefits awaiting you.
- Qlik Community
- :
- All Forums
- :
- QlikView App Dev
- :
- Linear trendline on a Scatterplot
- Subscribe to RSS Feed
- Mark Topic as New
- Mark Topic as Read
- Float this Topic for Current User
- Bookmark
- Subscribe
- Mute
- Printer Friendly Page
- Mark as New
- Bookmark
- Subscribe
- Mute
- Subscribe to RSS Feed
- Permalink
- Report Inappropriate Content
Linear trendline on a Scatterplot
Good Morning Qlikers,
Hope everyone is having a lovely day.
I am having a slight issue when adding a linear model using linest_m() and linest_b() to a scatter plot. As you can see from the scatter plot below I have calculated the gradient and y-intercept, but I am unable to add this is as a trend line.
Previous posts in the community have shown how to add a trend line to a bar chart by adding an extra measure ( How to add lineal trend in Qlik sense). However, as you cannot add extra measures to a scatter plot this method doesn't apply. So I attempted to add the trend line equation through Add-ons -> X-axis reference lines -> Add reference line. This still didn't work for me.
I have attached the data as a CSV file and also uploaded the QVF app.
Scatter plot of Material Property Vs Delta T
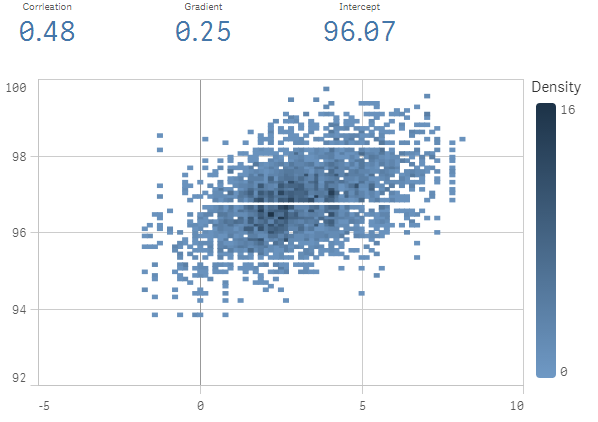
Background to data, investigating whether there is any correlation between varying process time (delta t) on material property.
All help is greatly appreciated!
Thanks
Steve
- Mark as New
- Bookmark
- Subscribe
- Mute
- Subscribe to RSS Feed
- Permalink
- Report Inappropriate Content
Linear trend line on a scatter plot, is this not possible? 

- Mark as New
- Bookmark
- Subscribe
- Mute
- Subscribe to RSS Feed
- Permalink
- Report Inappropriate Content
Steve
I've never gotten a good answer either - there are a few different threads out there - here is another one
Re: Diagonal reference line in scatter chart in Sense??
I'm reaching out again to the Qlik team to see where and when this is going to be added - its been in View for years.