Unlock a world of possibilities! Login now and discover the exclusive benefits awaiting you.
- Qlik Community
- :
- All Forums
- :
- QlikView App Dev
- :
- Linechart Expression side by side
- Subscribe to RSS Feed
- Mark Topic as New
- Mark Topic as Read
- Float this Topic for Current User
- Bookmark
- Subscribe
- Mute
- Printer Friendly Page
- Mark as New
- Bookmark
- Subscribe
- Mute
- Subscribe to RSS Feed
- Permalink
- Report Inappropriate Content
Linechart Expression side by side
Hi experts,
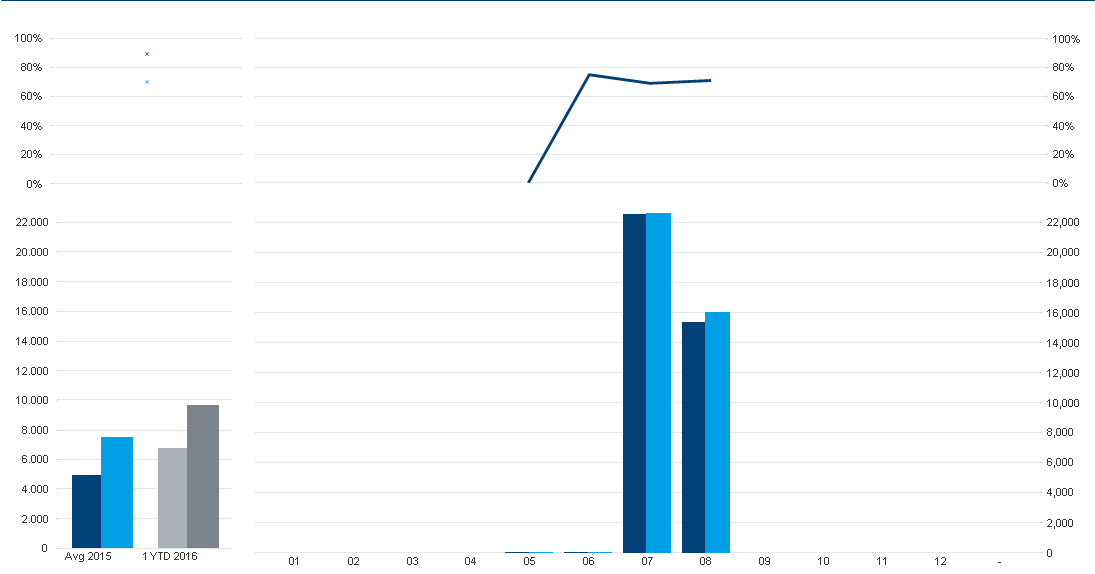
I have a linechart with no Dimension and two expressions
In the linechart the expressions are vertically aligned.
What I want is the Points in the linechart exactly over the correspondening
blocks of the barchart (for other purposes I use 2 objects, but even using 1
object doesnot work as wanted)
Additionally I wonder why I have in the right Chart
the text "1YTD 2016". I have an invisible Expression with Definition 1
to separate the two blocks (when I use empty Definition the blocks
are next to each other). Any idea?
Don't wonder about 2016. This is relating to fiscal year and fiscal year 2016
started already!

- Mark as New
- Bookmark
- Subscribe
- Mute
- Subscribe to RSS Feed
- Permalink
- Report Inappropriate Content
What I want is the Points in the linechart exactly over the correspondening
blocks of the barchart (for other purposes I use 2 objects, but even using 1
object doesnot work as wanted)
Then you need to add the same dimensions to the line chart as you have in the bar chart.
talk is cheap, supply exceeds demand
- Mark as New
- Bookmark
- Subscribe
- Mute
- Subscribe to RSS Feed
- Permalink
- Report Inappropriate Content
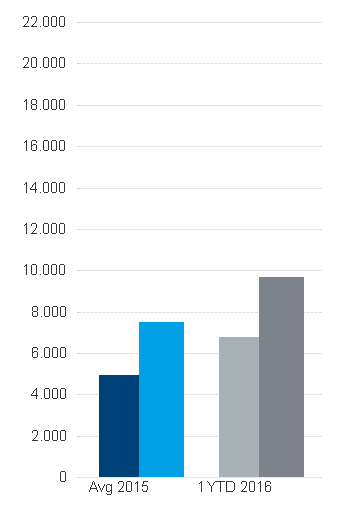
in the barchart there is also no dimension defefined (but 5 expressions with 1 invisible)
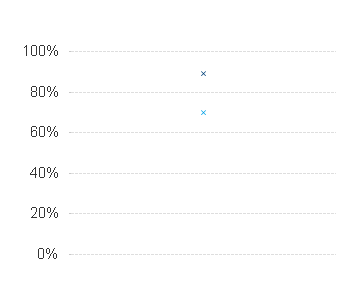
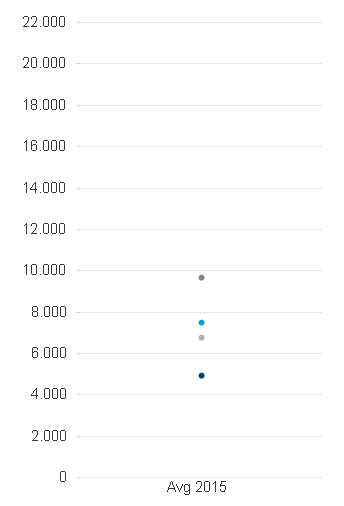
as soon as i Change the barchart to a linechart I get 4 Points vertically
Why is there a difference between barchart and linechart? I want it horizontally like barchart??
- Mark as New
- Bookmark
- Subscribe
- Mute
- Subscribe to RSS Feed
- Permalink
- Report Inappropriate Content
Well, bars have width. Points don't. So if you have several bars for one dimension value then they're either grouped next to each other or stacked. The starts and ends of a line segment will simply be placed above the dimension value.
talk is cheap, supply exceeds demand
- Mark as New
- Bookmark
- Subscribe
- Mute
- Subscribe to RSS Feed
- Permalink
- Report Inappropriate Content
so no Chance, no Workaround (except making two objects)?
- Mark as New
- Bookmark
- Subscribe
- Mute
- Subscribe to RSS Feed
- Permalink
- Report Inappropriate Content
I don't think so. I've tried some things, but no luck so far.
talk is cheap, supply exceeds demand
- Mark as New
- Bookmark
- Subscribe
- Mute
- Subscribe to RSS Feed
- Permalink
- Report Inappropriate Content
I tried also
but as I have a Container with 4 objects, i then need a Container with 6 objects
I have to divide the left barchart also (or alternatively I need to place the objects without using a container)