Unlock a world of possibilities! Login now and discover the exclusive benefits awaiting you.
- Qlik Community
- :
- All Forums
- :
- QlikView App Dev
- :
- Linest M Errors
- Subscribe to RSS Feed
- Mark Topic as New
- Mark Topic as Read
- Float this Topic for Current User
- Bookmark
- Subscribe
- Mute
- Printer Friendly Page
- Mark as New
- Bookmark
- Subscribe
- Mute
- Subscribe to RSS Feed
- Permalink
- Report Inappropriate Content
Linest M Errors
Hello,
I am trying to get the Linest_M function working, the goal is for when the slope is positive the line is green, and when it is negative it is red. the x value is YearMonth and the Y value is Sum([Billing Quantity])/Sum(#Units)
Here is what I have:
=if(
LINEST_M(Sum([Billing Quantity])/Sum(#Units), YearMonth)
<0, rgb(247,93,79),rgb(155,215,247)
)
Please let me know how to correct this
Accepted Solutions
- Mark as New
- Bookmark
- Subscribe
- Mute
- Subscribe to RSS Feed
- Permalink
- Report Inappropriate Content
May be try this
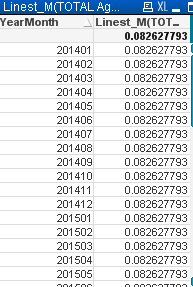
=If(Linest_M(TOTAL Aggr(Sum([Billing Quantity])/Sum(#Units), YearMonth), YearMonth) < 0, RGB(247,93,79), RGB(155,215,247))
- Mark as New
- Bookmark
- Subscribe
- Mute
- Subscribe to RSS Feed
- Permalink
- Report Inappropriate Content
May be try this
=If(Linest_M(TOTAL Aggr(Sum([Billing Quantity])/Sum(#Units), YearMonth), YearMonth) < 0, RGB(247,93,79), RGB(155,215,247))
- Mark as New
- Bookmark
- Subscribe
- Mute
- Subscribe to RSS Feed
- Permalink
- Report Inappropriate Content
Is it supposed to fluctuate by the x value?
- Mark as New
- Bookmark
- Subscribe
- Mute
- Subscribe to RSS Feed
- Permalink
- Report Inappropriate Content
Really, why? you want to know the slope of the line, right? Slope stays the same, doesn't it? 
- Mark as New
- Bookmark
- Subscribe
- Mute
- Subscribe to RSS Feed
- Permalink
- Report Inappropriate Content
Ideally it would be a monthly snapshot of the slope, as if taking a derivative of the original line, but that might not be the way the function works.
- Mark as New
- Bookmark
- Subscribe
- Mute
- Subscribe to RSS Feed
- Permalink
- Report Inappropriate Content
Are you looking to find the monthly slope based on daily data? May be try this
Linest_M(Aggr(Sum([Billing Quantity])/Sum(#Units), YearMonth), YearMonth, Date)