Unlock a world of possibilities! Login now and discover the exclusive benefits awaiting you.
- Qlik Community
- :
- All Forums
- :
- QlikView App Dev
- :
- List, SubField and textCount
- Subscribe to RSS Feed
- Mark Topic as New
- Mark Topic as Read
- Float this Topic for Current User
- Bookmark
- Subscribe
- Mute
- Printer Friendly Page
- Mark as New
- Bookmark
- Subscribe
- Mute
- Subscribe to RSS Feed
- Permalink
- Report Inappropriate Content
List, SubField and textCount
TextCount is not reflective on Charts....
Step1. Load Script is shownbelow.
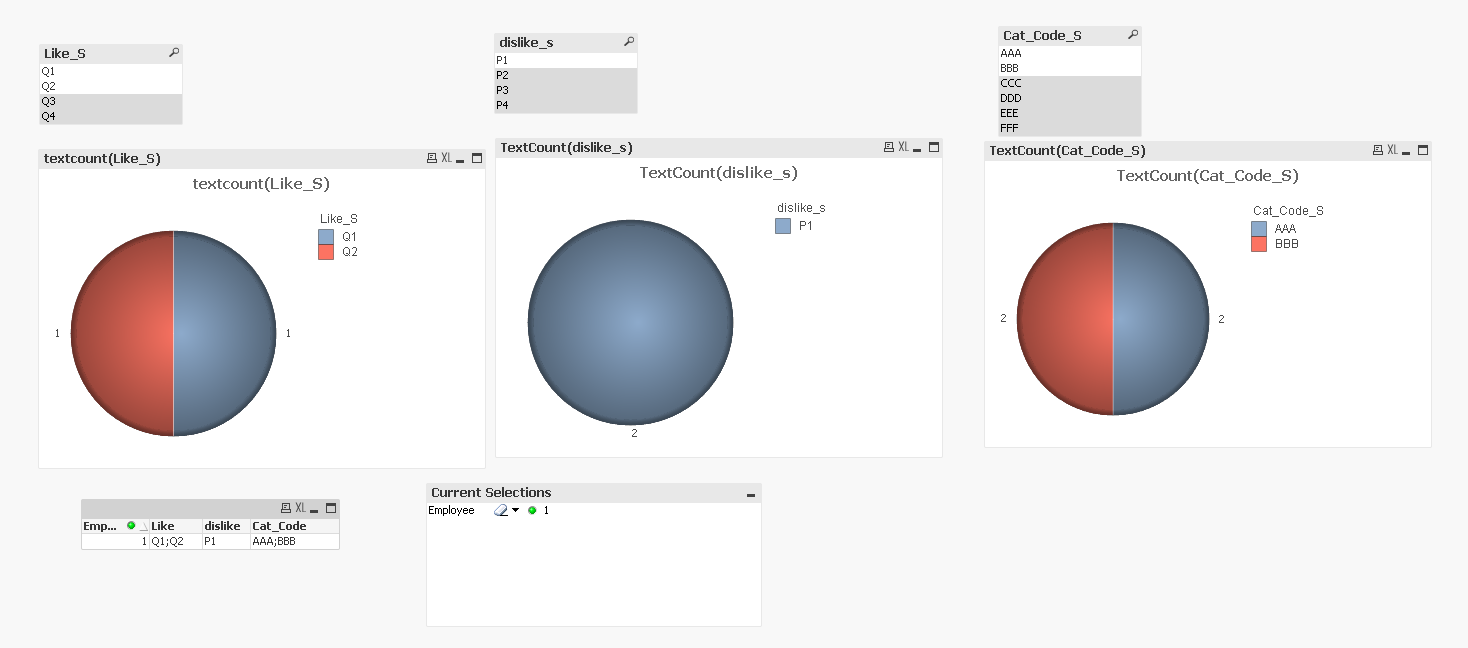
Step2. Create 3 Pie Charts using Dimension as Like_s, Dislike_s and Cat_Code_s and Expression as textcount(Like_S), textcount(Dislike_s) and textcount(Cat_Code_s) respectively. Refer Attachment.
Step3: Select Employee = 1 and then Pie Chart with Cat_Code_s shows Count for AAA as 2 and Count of BBB as 2.
Expected Count should be AAA as 1 and BBB as 1. Refer Attachment
SampleData:
Load * inline
[
Employee,Like,dislike,Cat_Code
1,Q1;Q2,P1,AAA;BBB
2,Q1,P2,AAA;BBB
3,Q1;Q3;Q4,P1;P2,CCC
4,Q2,P3,DDD;EEE;AAA;BBB
5,Q3,P3;P4;P2,FFF
6,Q4,P1,AAA
];
Link_Like:
load
Like,
trim(subfield(Like, ';')) as Like_S
Resident SampleData;
Link_dislike:
load
dislike,
trim(subfield(dislike, ';')) as dislike_s
Resident SampleData;
Link_ManagerCat_Code:
Load
Cat_Code,
trim(subfield(Cat_Code, ';')) as Cat_Code_S
Resident SampleData;
- Tags:
- new_to_qlikview
- Mark as New
- Bookmark
- Subscribe
- Mute
- Subscribe to RSS Feed
- Permalink
- Report Inappropriate Content
Employee links to Cat_Code_S via Cat_Code 'AAA;BBB'.
Since in your SampleData table, there are two entries for Cat_Code 'AAA;BBB' (Emp 1 and 2), there are also two records for Cat_Code_S values 'AAA' resp. 'BBB'. I can't see anything wrong here.
Are you maybe after a DISTINCT LOAD?
Link_ManagerCat_Code:
Load DISTINCT
Cat_Code,
trim(subfield(Cat_Code, ';')) as Cat_Code_S
Resident SampleData;
- Mark as New
- Bookmark
- Subscribe
- Mute
- Subscribe to RSS Feed
- Permalink
- Report Inappropriate Content
Yes, Load DISTICNT solves the problem but when we have repititive values(Emp#6 ,7 and 😎 the graph is not accurate(when nothing is selected).
Employee,Like,dislike,Cat_Code
1,Q1;Q2,P1,AAA;BBB
2,Q1,P2,AAA;BBB
3,Q1;Q3;Q4,P1;P2,CCC
4,Q2,P3,DDD;EEE;AAA;BBB
5,Q3,P3;P4;P2,FFF
6,Q4,P1,AAA /*when nothing is selected Count is shown as 3 but expected value for AAA should be 6*/
7,Q4,P1,AAA
8,Q4,P1,AAA
- Mark as New
- Bookmark
- Subscribe
- Mute
- Subscribe to RSS Feed
- Permalink
- Report Inappropriate Content
Maybe you want a
=Count(Employee)
instead of your TextCount(Cat_Code_S) then.
- Mark as New
- Bookmark
- Subscribe
- Mute
- Subscribe to RSS Feed
- Permalink
- Report Inappropriate Content
So after using distinct load and count(employee)...When we select a value on the List, say- 'AAA'. other values which intersect say - 'BBB' are not visible on the graph...
- Mark as New
- Bookmark
- Subscribe
- Mute
- Subscribe to RSS Feed
- Permalink
- Report Inappropriate Content
That's the standard QV behaviour, isn't it? When you select a value in a dimension, all other dimension values will be excluded. Your original script and charts as described above show the same behaviour, right?
If you want to see the connected Cat_Code_S values (which is a new and different requirement), I think you would need set analysis in your chart expression, something like
=Count({<Cat_Code = p(), Cat_Code_S =>} Employee)
See also attached.