Unlock a world of possibilities! Login now and discover the exclusive benefits awaiting you.
- Qlik Community
- :
- All Forums
- :
- QlikView App Dev
- :
- List all dates available in calendar in chart
- Subscribe to RSS Feed
- Mark Topic as New
- Mark Topic as Read
- Float this Topic for Current User
- Bookmark
- Subscribe
- Mute
- Printer Friendly Page
- Mark as New
- Bookmark
- Subscribe
- Mute
- Subscribe to RSS Feed
- Permalink
- Report Inappropriate Content
List all dates available in calendar in chart
Hi all,
I am trying to create an integrity chart that would warn the user when data is missing.
I have a calendar that has all available dates but unsure how to display all dates in a chart regardless of if there is data against those dates.
i have attached a sample..
basically i have a possible date range of 04/10/2013 - 25/10/2013.
Company A and B have vales against the complete date range
Company C only have values up to 20/10/2013, so i want to see the remaining 5 days in the chart.
When i add in the Date dimension, i am only getting dates for Company C where there are values.
Any help would be appreciated.
Thanks
- Mark as New
- Bookmark
- Subscribe
- Mute
- Subscribe to RSS Feed
- Permalink
- Report Inappropriate Content
ok, i have found out how to do that, show all values on dimension tab.
but now i want to hide all the dates that have values. so i only want to see dates where there are values missing.
- Mark as New
- Bookmark
- Subscribe
- Mute
- Subscribe to RSS Feed
- Permalink
- Report Inappropriate Content
See this
- Mark as New
- Bookmark
- Subscribe
- Mute
- Subscribe to RSS Feed
- Permalink
- Report Inappropriate Content
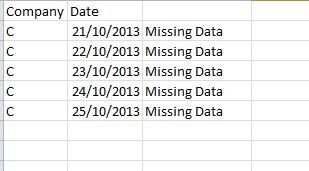
Thanks, i now need to hide all the 'Correct' lines and only show the 'Missing Data' lines.
Also, is there a way i can populate the Company field so i know which company has the missing data?
So this is what i want to see in the chart
- Mark as New
- Bookmark
- Subscribe
- Mute
- Subscribe to RSS Feed
- Permalink
- Report Inappropriate Content
does anyone have any suggestions on this?
I assume i need a flag which says whether or not values exist for each company on each available date?
- Mark as New
- Bookmark
- Subscribe
- Mute
- Subscribe to RSS Feed
- Permalink
- Report Inappropriate Content
any more suggestions would be great 
- Mark as New
- Bookmark
- Subscribe
- Mute
- Subscribe to RSS Feed
- Permalink
- Report Inappropriate Content
This might not be the way you want to go, but it has always worked for me (in various forms).
I test for nulls or missing values in the script when my data is as linear as this Excel sheet. Then you have an automatic 'dummy' value to test for and suppress in reports.
Note: I used -1 to be obvious. It could say 'Missing' or 'None' or whatever.
Again, quick and dirty. To do this right, you'd need to break out your calendar into a separate table and outer join to the numeric data in the script.
Hope it helps.