Unlock a world of possibilities! Login now and discover the exclusive benefits awaiting you.
- Qlik Community
- :
- All Forums
- :
- QlikView App Dev
- :
- Re: List box multiple selection and variable not w...
- Subscribe to RSS Feed
- Mark Topic as New
- Mark Topic as Read
- Float this Topic for Current User
- Bookmark
- Subscribe
- Mute
- Printer Friendly Page
- Mark as New
- Bookmark
- Subscribe
- Mute
- Subscribe to RSS Feed
- Permalink
- Report Inappropriate Content
List box multiple selection and variable not working
Dear Experts ,
Greetings !
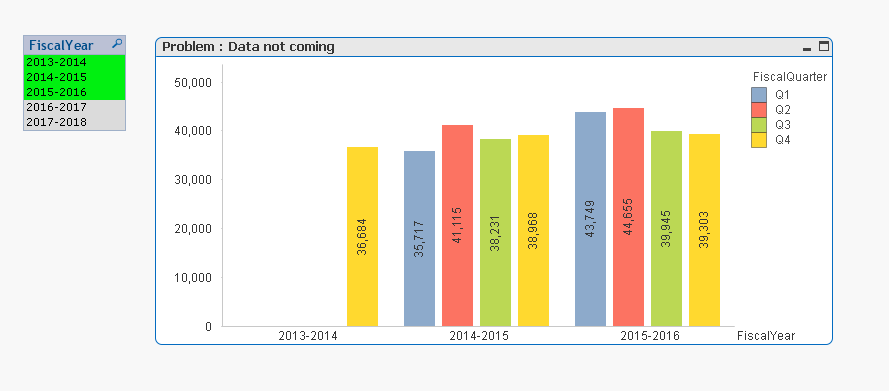
Attached is the my document. Its working fine when I select the single Fiscal Year . But when I select multiple fiscal years, my last graph is not displaying the data. All variables are populating data correctly in text item. But not able to use in expression.
You suggestions / help is highly appreciated.
Thanks.
Regards,
Milind.
- « Previous Replies
-
- 1
- 2
- Next Replies »
- Mark as New
- Bookmark
- Subscribe
- Mute
- Subscribe to RSS Feed
- Permalink
- Report Inappropriate Content
so if you select two fiscal years (2015-2016, 2016-2017), you need to show 4 quarters corresponding to the years selected ??
- Mark as New
- Bookmark
- Subscribe
- Mute
- Subscribe to RSS Feed
- Permalink
- Report Inappropriate Content
Yes. I will replicate first chart two times. then change the subfiled value 1 / 2 / 3 respectively. Rest is same.
- Mark as New
- Bookmark
- Subscribe
- Mute
- Subscribe to RSS Feed
- Permalink
- Report Inappropriate Content
you mean it should look like this ?

- Mark as New
- Bookmark
- Subscribe
- Mute
- Subscribe to RSS Feed
- Permalink
- Report Inappropriate Content
This will be helpful. Either in one chart or 4 different charts with 4 quarters
- Mark as New
- Bookmark
- Subscribe
- Mute
- Subscribe to RSS Feed
- Permalink
- Report Inappropriate Content
Can you please share the qvw
- Mark as New
- Bookmark
- Subscribe
- Mute
- Subscribe to RSS Feed
- Permalink
- Report Inappropriate Content
Dear Dave ,
Please share me the above result QVW by the time.
Regards,
Milind.
- Mark as New
- Bookmark
- Subscribe
- Mute
- Subscribe to RSS Feed
- Permalink
- Report Inappropriate Content
Hi Milind
PFA
- Mark as New
- Bookmark
- Subscribe
- Mute
- Subscribe to RSS Feed
- Permalink
- Report Inappropriate Content
Dear Dave,
Thanks. I have resolved this using following expression. But still worried about qlik behavior . Its showing / bifurcating the multiple fiscal year in text item but I was not able to use it in expression. So I have written variable code directly in expression like this :
=If ( FiscalYear = SubField (GetFieldSelections([FiscalYear] , ', ',3),', ',1) ,
( Round ( if(getcurrentfield(CLY)='PRODT', sum([PRODUCTION TONS]) ,
if(getcurrentfield(CLY)='PRODQ', sum([PRODUCTIN(A+B)]) ,
if(getcurrentfield(CLY)='SCRAPT', sum([Scrap Tonnage]) ,
if(getcurrentfield(CLY)='SCRAPQ', sum([Scrap Qty]) ,
if(getcurrentfield(CLY)='SCRAPP', ( sum([Scrap Tonnage]) / sum([PRODUCTION TONS]) ) * 100
)
)
)
)
)
)
)
,0)
Thank you so much for your instant help.
Regards,
Milind.
- « Previous Replies
-
- 1
- 2
- Next Replies »