Unlock a world of possibilities! Login now and discover the exclusive benefits awaiting you.
- Qlik Community
- :
- All Forums
- :
- QlikView App Dev
- :
- Loop through chart(straight table) and perform cal...
- Subscribe to RSS Feed
- Mark Topic as New
- Mark Topic as Read
- Float this Topic for Current User
- Bookmark
- Subscribe
- Mute
- Printer Friendly Page
- Mark as New
- Bookmark
- Subscribe
- Mute
- Subscribe to RSS Feed
- Permalink
- Report Inappropriate Content
Loop through chart(straight table) and perform calculations
Hi Guys,
I have a kind of unusual task for me. I need to loop through chart values and asign records to specific flag according to calculation results. Here is my chart that i need to make calculations:
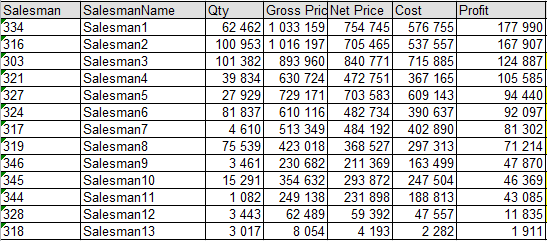
What i need to do now is to sum the entire colum Profit and dive it by 3. This is ok i can aproach it.
when io sum and divide by 3 i get 1 066 491/3=355 497.
What i have to doo now is to start looping from the first record(records are sorted by largest to smallest) and start summing until the sum of summed records is >= to 355 497(the number i got when divided the whole sum).
So in this case Salesman1, Salesman2, Salesman 3 fulfill my condition and i have to mark them as a flag A.
Then when i have Found A records already i need to continue where i stopped. I will start summing from Salesman4,salesman5,salesman6,salesman7 and again when i reach 355 497 i stop and mark those records as a flag B
all the remaining records below last record with B i mark as a C.
This is like a simple for or while loop but how to write it in qlikview? Can i approach it via expressions or have to do it in load script. If you guys could help me i would save my next days:)
Thanks
- « Previous Replies
-
- 1
- 2
- Next Replies »
- Mark as New
- Bookmark
- Subscribe
- Mute
- Subscribe to RSS Feed
- Permalink
- Report Inappropriate Content
I think i can't do it in the backend because in the front end i calculate Sum(profit) and the Sum(profit) changes dynamicaly if i select some other drill down values like date, City o some kind of products catagery.
If i calculate the values in the back end - it will not change.
- « Previous Replies
-
- 1
- 2
- Next Replies »