Unlock a world of possibilities! Login now and discover the exclusive benefits awaiting you.
- Qlik Community
- :
- All Forums
- :
- QlikView App Dev
- :
- MAT creation
- Subscribe to RSS Feed
- Mark Topic as New
- Mark Topic as Read
- Float this Topic for Current User
- Bookmark
- Subscribe
- Mute
- Printer Friendly Page
- Mark as New
- Bookmark
- Subscribe
- Mute
- Subscribe to RSS Feed
- Permalink
- Report Inappropriate Content
MAT creation
Hi Team,
I have a data about
Year, Month, SalesAmount (StdUnits).
Now, my requirement is, i have to create a line chart with below expressions.
1. Dimension: Month
2. Expression: Sum(SalesAmount(StdUnits).
Question: as per my knowledge , MAT is the last 12 months total. for example, for month Jan 2016 , the MAT is sum of sales from Feb 2015 to Jan 2016
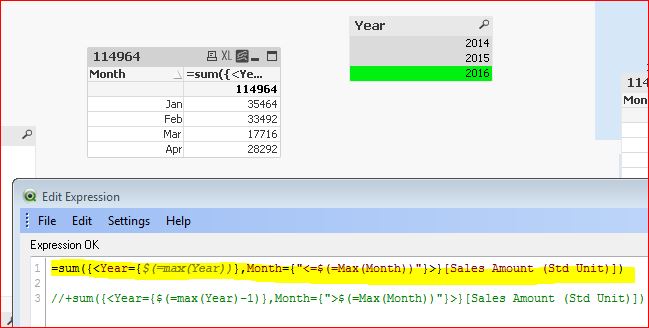
I have just created text with the expression "=sum({<Year={$(=max(Year))},Month={"<=$(=Max(Month))"}>}[Sales Amount (Std Unit)])+sum({<Year={$(=max(Year)-1)},Month={">$(=Max(Month))"}>}[Sales Amount (Std Unit)])". It is giving the correct total in text box.
If i use the same expression in my chart , it is not showing correctly.
I have data from 2014 May to 2016 Apr. So, if i select 2016 as my year, then it should show the chart dimension for
Jan, Feb, Mar, Apr. But it is showing all the months from Jan to Dec.
Actually it should show MAT for Jan, Feb, Mar , Apr.
Please help me in getting this MAT.
Note: I am using the qlikview personal edition. So, Please copy the code here as i am not able to open the qvw from my personal edition.
Attaching the sample data and qvw here.
Regards
Srinivas
- « Previous Replies
-
- 1
- 2
- Next Replies »
Accepted Solutions
- Mark as New
- Bookmark
- Subscribe
- Mute
- Subscribe to RSS Feed
- Permalink
- Report Inappropriate Content
Can you check now, I have used the As-OfTable Approach in the chart
- Mark as New
- Bookmark
- Subscribe
- Mute
- Subscribe to RSS Feed
- Permalink
- Report Inappropriate Content
Why would you want to see only Jan, Feb, Mar and Apr for 2016 if MAT is last 12 months? Would you be able to elaborate?
- Mark as New
- Bookmark
- Subscribe
- Mute
- Subscribe to RSS Feed
- Permalink
- Report Inappropriate Content
I have data in 2016 till April. If I select 2016 as my year then it should show the MAT for 2016 Jan, Feb, Mar, Apr.
If the Year is 2015, then Jan to Dec MAT should show for each month.
- Mark as New
- Bookmark
- Subscribe
- Mute
- Subscribe to RSS Feed
- Permalink
- Report Inappropriate Content
Can you check now, I have used the As-OfTable Approach in the chart
- Mark as New
- Bookmark
- Subscribe
- Mute
- Subscribe to RSS Feed
- Permalink
- Report Inappropriate Content
Hi,
Can you tell, Why did you sum the ">Month" expression? if you remove that it will also give the same result..
for 2016, it shows Jan to Apr data.. Look the below screen shot..
- Mark as New
- Bookmark
- Subscribe
- Mute
- Subscribe to RSS Feed
- Permalink
- Report Inappropriate Content
From what I have heard MAT is sum for last 12 months. So for Jan 2016, it would be a sum of all numbers from Feb 2015 till Jan 2016. I think it might be doable using Above function, but I have used the AsOfTable approach above. Can you also check to see if it make sense 
- Mark as New
- Bookmark
- Subscribe
- Mute
- Subscribe to RSS Feed
- Permalink
- Report Inappropriate Content
Yes sunny. I didn't read the OP properly. Your suggestion makes sense.
- Mark as New
- Bookmark
- Subscribe
- Mute
- Subscribe to RSS Feed
- Permalink
- Report Inappropriate Content
Hi Sunny,
Can you please help me in displaying the 12 months on the X-Axis.
for MAT, if we consider 'MAY' is current month then the x-axis should display data from jun-2015 to may -2016.
Please let me know if you need any additional info.
Regards
Srinivas
- Mark as New
- Bookmark
- Subscribe
- Mute
- Subscribe to RSS Feed
- Permalink
- Report Inappropriate Content
Check if the attached is what you are looking for.
Expression used
=Sum({<Month, Year, ReportYearMonth = {"$(='>' & Date(AddMonths(Max(ReportYearMonth), -12), 'YYYYMM') & '<=' & Date(AddMonths(Max(ReportYearMonth), 0), 'YYYYMM'))"}, ReportYear, ReportMonth>}[Sales Amount (Std Unit)])
- Mark as New
- Bookmark
- Subscribe
- Mute
- Subscribe to RSS Feed
- Permalink
- Report Inappropriate Content
Thanks Sunny for your time .
This is creating the correct dimension.
I have a issue here. I have to calculate Evaluation Index.
evaluation index= current Year market share / Previous Year Market share
Market share=Sales Amount (Std Unit)/Market Sales (Std Unit)
As per the above expression you written, we made 'Year' as constant.. It will not change.
=Sum({<Month, Year, ReportYearMonth = {"$(='>' & Date(AddMonths(Max(ReportYearMonth), -12), 'YYYYMM') & '<=' & Date(AddMonths(Max(ReportYearMonth), 0), 'YYYYMM'))"}, ReportYear, ReportMonth>}[Sales Amount (Std Unit)])
But, while calculating evolution index, i need to have previous year market share as well as current year market share.
Please help me here.
Regards
Srinivas
- « Previous Replies
-
- 1
- 2
- Next Replies »