Unlock a world of possibilities! Login now and discover the exclusive benefits awaiting you.
- Qlik Community
- :
- All Forums
- :
- QlikView App Dev
- :
- Make Scatterplot show selection and grey other val...
Options
- Subscribe to RSS Feed
- Mark Topic as New
- Mark Topic as Read
- Float this Topic for Current User
- Bookmark
- Subscribe
- Mute
- Printer Friendly Page
Turn on suggestions
Auto-suggest helps you quickly narrow down your search results by suggesting possible matches as you type.
Showing results for
Creator
2017-09-11
05:07 PM
- Mark as New
- Bookmark
- Subscribe
- Mute
- Subscribe to RSS Feed
- Permalink
- Report Inappropriate Content
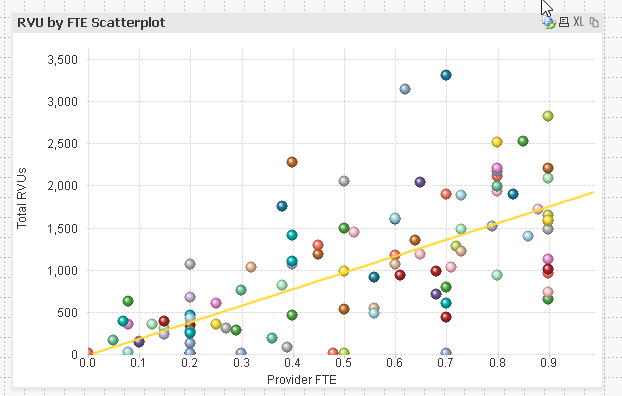
Make Scatterplot show selection and grey other values
I'm trying to do the following, but not with a line chart.
https://community.qlikview.com/blogs/qlikviewdesignblog/2014/02/07/line-chart-tricks-part-two#
Ishiness (or Keeping an Overall Sense of Where You Are in the Data Space)
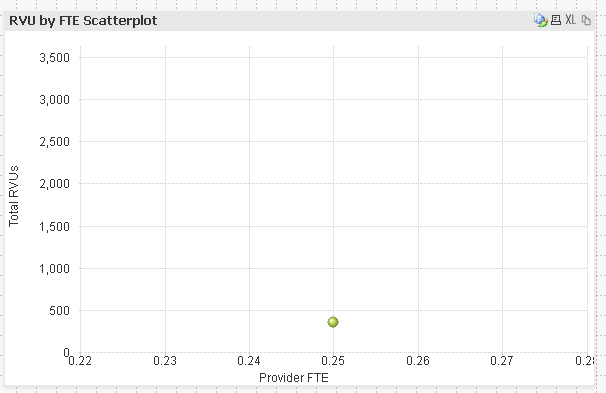
I want all of the other values except what I'm selecting to be greyed out, and to highlight what I selected. When I click on a Clinician's name, all of the other values disappear.
Dimension: Clinician Name
Expression 1: Provider FTE = [YTD Avg]
Expression 2: Total RVUs = Sum({1} [RVU WORK])
2,294 Views
- « Previous Replies
-
- 1
- 2
- Next Replies »
10 Replies
Partner - Creator III
2017-09-12
09:32 AM
- Mark as New
- Bookmark
- Subscribe
- Mute
- Subscribe to RSS Feed
- Permalink
- Report Inappropriate Content
with pleasure!
Have a great day!
Andrei
201 Views
- « Previous Replies
-
- 1
- 2
- Next Replies »