Unlock a world of possibilities! Login now and discover the exclusive benefits awaiting you.
- Qlik Community
- :
- All Forums
- :
- QlikView App Dev
- :
- Maximum month selection and application of filters
- Subscribe to RSS Feed
- Mark Topic as New
- Mark Topic as Read
- Float this Topic for Current User
- Bookmark
- Subscribe
- Mute
- Printer Friendly Page
- Mark as New
- Bookmark
- Subscribe
- Mute
- Subscribe to RSS Feed
- Permalink
- Report Inappropriate Content
Maximum month selection and application of filters
Hello Guys!
I am trying to create a YTM graph using current and last year data. As of now, I want the YTM graph to show values upto June, for last year but I am not sure which expression syntax is to be used here. Once the max no. of months selection has been made, I would like the month filter applied to it so that if I select the first 3 months, the YTM graph shows me data for the first 3 months and so on. I would also like to define the year in this expression. Please suggest as to how this can be done.
Regards,
Rony
- Tags:
- new to qlik sense
- Mark as New
- Bookmark
- Subscribe
- Mute
- Subscribe to RSS Feed
- Permalink
- Report Inappropriate Content
Hi,
Can you share the sample data and explain what you need with example, that will help all of us to understand your requirement clearly.
Regards,
Kaushik Solanki
- Mark as New
- Bookmark
- Subscribe
- Mute
- Subscribe to RSS Feed
- Permalink
- Report Inappropriate Content
Kaushik,
Below is sample data. I want to create a Year to Month graph defining values upto June, cumulatively and specify the year at the same time, within the expression. Also, month filters should be applicable to this graph so that if I the select the first 3 months in the month filter, the graph shows me cumulative value upto March and so on. Basically, I should be able to define the maximum number of months in the YTM graph and change it according to my requirement.Hope this is more clear. Please advise.
| Year | Month | Value |
| 2017 | Jan | 100 |
| 2017 | Feb | 200 |
| 2017 | Mar | 300 |
| 2017 | Apr | 400 |
| 2017 | May | 500 |
| 2017 | Jun | 600 |
| 2017 | Jul | 700 |
| 2017 | Aug | 800 |
| 2017 | Sep | 900 |
| 2017 | Oct | 1000 |
| 2017 | Nov | 1100 |
| 2017 | Dec | 1200 |
| 2018 | Jan | 1300 |
| 2018 | Feb | 1400 |
| 2018 | Mar | 1500 |
| 2018 | Apr | 1600 |
| 2018 | May | 1700 |
| 2018 | Jun | 1800 |
| 2018 | Jul | 1900 |
| 2018 | Aug | 2000 |
| 2018 | Sep | 2100 |
| 2018 | Oct | 2200 |
| 2018 | Nov | 2300 |
| 2018 | Dec | 2400 |
Regards,
Rony
- Mark as New
- Bookmark
- Subscribe
- Mute
- Subscribe to RSS Feed
- Permalink
- Report Inappropriate Content
Do you mean that by Default it should show data from Jan to dec, but when you select the Aug Month it should show from Jan to Aug?
Regards,
Kaushik Solanki
- Mark as New
- Bookmark
- Subscribe
- Mute
- Subscribe to RSS Feed
- Permalink
- Report Inappropriate Content
By default it should show upto June. When I select Jan, Feb, March in filter, cumulative value upto March should be shown.
Regards,
Rony
- Mark as New
- Bookmark
- Subscribe
- Mute
- Subscribe to RSS Feed
- Permalink
- Report Inappropriate Content
I am looking for an expression where I can define the maximum number of months I want to show.
Regards,
Rony
- Mark as New
- Bookmark
- Subscribe
- Mute
- Subscribe to RSS Feed
- Permalink
- Report Inappropriate Content
Hi Guys,
Any suggestions on this.?
Regards,
Rony
- Mark as New
- Bookmark
- Subscribe
- Mute
- Subscribe to RSS Feed
- Permalink
- Report Inappropriate Content
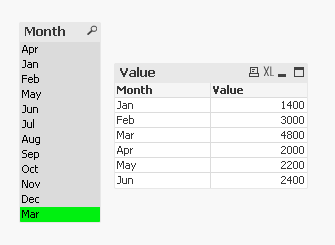
Not sure i understand, But is this you are expecting from your sample data?
- Mark as New
- Bookmark
- Subscribe
- Mute
- Subscribe to RSS Feed
- Permalink
- Report Inappropriate Content
Hi Anil,
I figured this out. Thanks for your response.
Regards,
Rony