Unlock a world of possibilities! Login now and discover the exclusive benefits awaiting you.
- Qlik Community
- :
- All Forums
- :
- QlikView App Dev
- :
- Median of several expressions
- Subscribe to RSS Feed
- Mark Topic as New
- Mark Topic as Read
- Float this Topic for Current User
- Bookmark
- Subscribe
- Mute
- Printer Friendly Page
- Mark as New
- Bookmark
- Subscribe
- Mute
- Subscribe to RSS Feed
- Permalink
- Report Inappropriate Content
Median of several expressions
Hi All
I calculated the loss ratio per month for the accident years
| Month | AY 2010 | AY 2011 | AY 2012 | AY 2013 | AY 2014 | AY 2015 |
| 1 | 50% | 60% | 77% | 66% | 74% | 58% |
| 2 | 60% | 90% | 88% | 67% | 66% | 59% |
| 3 | 40% | 90% | 90% | 68% | 85% | 60% |
| 4 | 60% | 95% | 105% | 90% | 90% | 40% |
| 5 | 70% | 100% | 99% | 80% | 100% | 60% |
AY 2010 to AY 2015 are expressions.
I would now like to calculate the median of the expression values.
I tried
Median([AY 2010],[AY 2011],[AY 2012],[AY 2013],[AY 2014],[AY 2015])
But that does not work. How could I calculate the median of the 6 expressions?
Many thanks.
Best regards,
Jan
- Mark as New
- Bookmark
- Subscribe
- Mute
- Subscribe to RSS Feed
- Permalink
- Report Inappropriate Content
Hi Jan,
Try using CROSSTABLE in front of your load statement in the script:
CROSSTABLE LOAD * INLINE [
Month, AY 2010, AY 2011, AY 2012, AY 2013, AY 2014, AY 2015
1, 50%, 60%, 77%, 66%, 74%, 58%
2, 60%, 90%, 88%, 67%, 66%, 59%
3, 40%, 90%, 90%, 68%, 85%, 60%
4, 60%, 95%, 105%, 90%, 90%, 40%
5, 70%, 100%, 99%, 80%, 100%, 60%
];
- Mark as New
- Bookmark
- Subscribe
- Mute
- Subscribe to RSS Feed
- Permalink
- Report Inappropriate Content
Hi Jan,
This function also gives results:
MEDIAN(AGGR([AY 2010],[AY 2011],[AY 2012],[AY 2013],[AY 2014],[AY 2015]))
this result = 0.6 while the result from my previous answer is 0.72. Not sure which one is correct.
- Mark as New
- Bookmark
- Subscribe
- Mute
- Subscribe to RSS Feed
- Permalink
- Report Inappropriate Content
You could use rangefractile() for it like described in the help:
rangefractile(quantil ,formel1 [ , formel2, ... formelN ])
Liefert das Quantil der numerischen Werte innerhalb der Argumente 1 bis N.
Die Menge der Argumente dieser Funktion kann durch „Inter-Record-Funktionen“ (siehe Inter-Record-Funktionen im Diagramm) berechnet werden, mit einem dritten optionalen Parameter, der auch wieder eine Anzahl Werte liefert.
Beispiele:
| rangefractile (0.24,1,2,4,6) | liefert 1 |
| rangefractile (0.5,1,2,3,4,6) | liefert 3 |
| rangefractile (0.5,1,2,5,6) | liefert 3,5 |
| rangefractile (0.5, above(sum(x),-1,3)) | liefert den Median der drei Ergebnisse der sum(x)-Funktion, berechnet anhand der Werte der Zeile nach der aktuellen Zeile, der aktuellen Zeile und der Zeile vor der aktuellen Zeile. |
- Marcus
- Mark as New
- Bookmark
- Subscribe
- Mute
- Subscribe to RSS Feed
- Permalink
- Report Inappropriate Content
Hi,
two examples of possible solutions, using the already proposed crosstable and Median(Aggr()) functions as well as a conditional selection of expressions based on the Secondarydimensionality() in a pivot table:
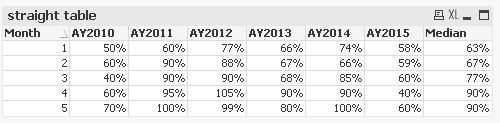
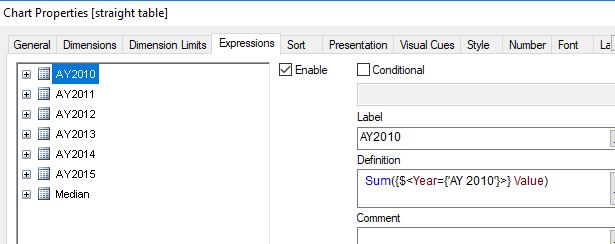
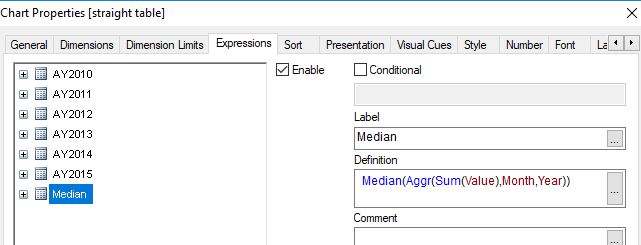
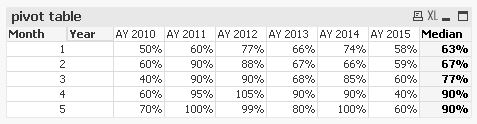
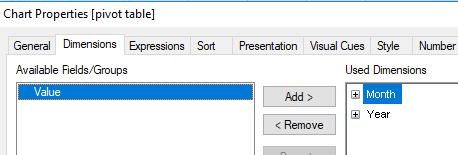
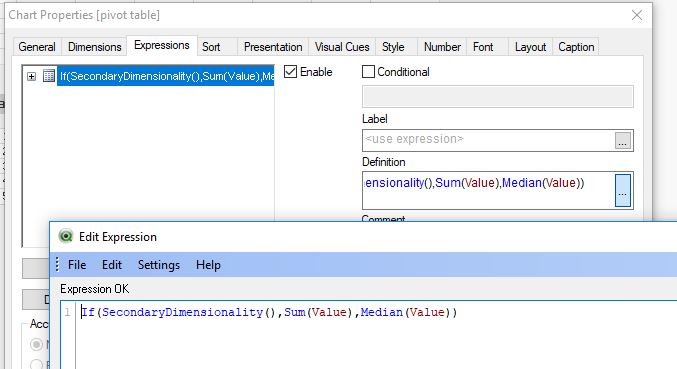
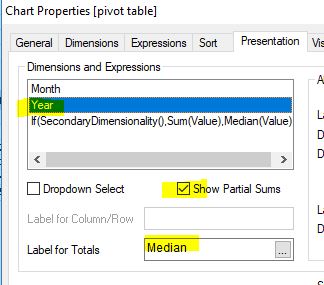
table1:
CrossTable (Year,Value)
LOAD * FROM [https://community.qlik.com/thread/283240] (html, codepage is 1252, embedded labels, table is @1);
hope this helps
regards
Marco