Unlock a world of possibilities! Login now and discover the exclusive benefits awaiting you.
- Qlik Community
- :
- All Forums
- :
- QlikView App Dev
- :
- Micro chart trend
- Subscribe to RSS Feed
- Mark Topic as New
- Mark Topic as Read
- Float this Topic for Current User
- Bookmark
- Subscribe
- Mute
- Printer Friendly Page
- Mark as New
- Bookmark
- Subscribe
- Mute
- Subscribe to RSS Feed
- Permalink
- Report Inappropriate Content
Micro chart trend
Hi All,
I have a requirement to show micro chart in straight table.In this I have customers and its tier dimension.Customers on the basis of sales divided into tiers.So if customer sales is high tier1 low tier10.
I want 12 month trend view micro chart how that customer tier changes over period of time.
Can anyone help me on this.
Regards,
Mayank
- « Previous Replies
-
- 1
- 2
- Next Replies »
- Mark as New
- Bookmark
- Subscribe
- Mute
- Subscribe to RSS Feed
- Permalink
- Report Inappropriate Content
Hi,
=aggr(if(
sum({<[tier]={"high tier"} >}sales)
, 1),customers) & aggr(if(
sum({<[tier]={"low tier"} >}sales)
, 10),customers)
Regards,
Joshua.
- Mark as New
- Bookmark
- Subscribe
- Mute
- Subscribe to RSS Feed
- Permalink
- Report Inappropriate Content
Hi Joshua,
I have a bit tricky requirement here.Do we have any extension that shows value of micro chart.In this we need to show that customers movement in tiers.For example:In jan month they are tier1 and feb tier2 and Mar tier7,So basic idea is to show at that month customers is in which tier.We have readily available separate tier column against customers.
Please let me know in case you need any other information.
Regards,
Mayank
- Mark as New
- Bookmark
- Subscribe
- Mute
- Subscribe to RSS Feed
- Permalink
- Report Inappropriate Content
Can any one suggest on this.
- Mark as New
- Bookmark
- Subscribe
- Mute
- Subscribe to RSS Feed
- Permalink
- Report Inappropriate Content
Hi,
could u pls provide me some sample excel files
- Mark as New
- Bookmark
- Subscribe
- Mute
- Subscribe to RSS Feed
- Permalink
- Report Inappropriate Content
| CUSTOMER NAME | time | Tier |
| Customer1 | 01-01-2015 | 2 |
| Customer1 | 01-02-2015 | 1 |
| Customer1 | 01-03-2015 | 4 |
| Customer1 | 01-04-2015 | 3 |
| Customer1 | 01-05-2015 | 5 |
| Customer1 | 01-06-2015 | 3 |
| Customer1 | 01-07-2015 | 4 |
| Customer1 | 01-08-2015 | 4 |
| Customer1 | 01-09-2015 | 3 |
| Customer1 | 01-10-2015 | 4 |
| Customer1 | 01-11-2015 | 6 |
| Customer1 | 01-12-2015 | 7 |
| Customer2 | 01-01-2015 | 3 |
| Customer2 | 01-02-2015 | 4 |
| Customer2 | 01-03-2015 | 4 |
| Customer2 | 01-04-2015 | 4 |
| Customer2 | 01-05-2015 | 5 |
| Customer2 | 01-06-2015 | 6 |
| Customer2 | 01-07-2015 | 2 |
| Customer2 | 01-08-2015 | 1 |
| Customer2 | 01-09-2015 | 1 |
| Customer2 | 01-10-2015 | 1 |
| Customer2 | 01-11-2015 | 1 |
| Customer2 | 01-12-2015 | 1 |
| Customer3 | 01-01-2015 | 6 |
| Customer3 | 01-02-2015 | 4 |
| Customer3 | 01-03-2015 | 2 |
| Customer3 | 01-04-2015 | 7 |
| Customer3 | 01-05-2015 | 2 |
| Customer3 | 01-06-2015 | 4 |
| Customer3 | 01-07-2015 | 2 |
| Customer3 | 01-08-2015 | 2 |
| Customer3 | 01-09-2015 | 1 |
| Customer3 | 01-10-2015 | 1 |
| Customer3 | 01-11-2015 | 1 |
| Customer3 | 01-12-2015 | 1 |
Here is the sample data:
Regards,
mayank
- Mark as New
- Bookmark
- Subscribe
- Mute
- Subscribe to RSS Feed
- Permalink
- Report Inappropriate Content
I am not sure I have understood your requirement completely but in the straight table
you can take Dimension : Customer , Tier
Expression : You can have the mini chart setting for Month
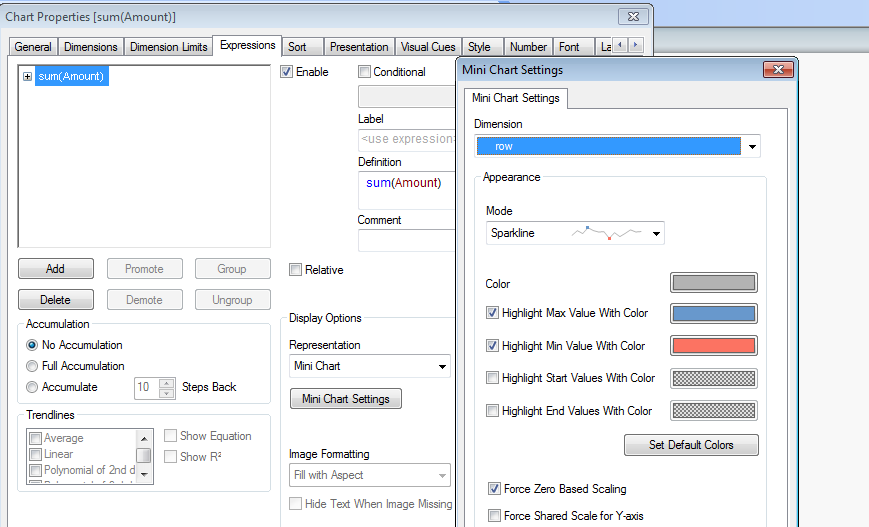
If possible you can post some required O/P how you want the display to be ?
- Mark as New
- Bookmark
- Subscribe
- Mute
- Subscribe to RSS Feed
- Permalink
- Report Inappropriate Content
Check this out, please 
Regards,
MB
- Mark as New
- Bookmark
- Subscribe
- Mute
- Subscribe to RSS Feed
- Permalink
- Report Inappropriate Content
Or maybe this.
Thank me later 
- « Previous Replies
-
- 1
- 2
- Next Replies »