Unlock a world of possibilities! Login now and discover the exclusive benefits awaiting you.
- Qlik Community
- :
- All Forums
- :
- QlikView App Dev
- :
- Min / max value for Class function
- Subscribe to RSS Feed
- Mark Topic as New
- Mark Topic as Read
- Float this Topic for Current User
- Bookmark
- Subscribe
- Mute
- Printer Friendly Page
- Mark as New
- Bookmark
- Subscribe
- Mute
- Subscribe to RSS Feed
- Permalink
- Report Inappropriate Content
Min / max value for Class function
Hi everyone,
I would like to specify a min and max value for my chart.
x-axis: score buckets at 0.5 intervals
y-axis: number of test takers
The test is out of 5 so I would like the x-axis to start at 0 and end at 5. My problem is that everyone scored between 2-4 so the x-axis is only showing the following values:
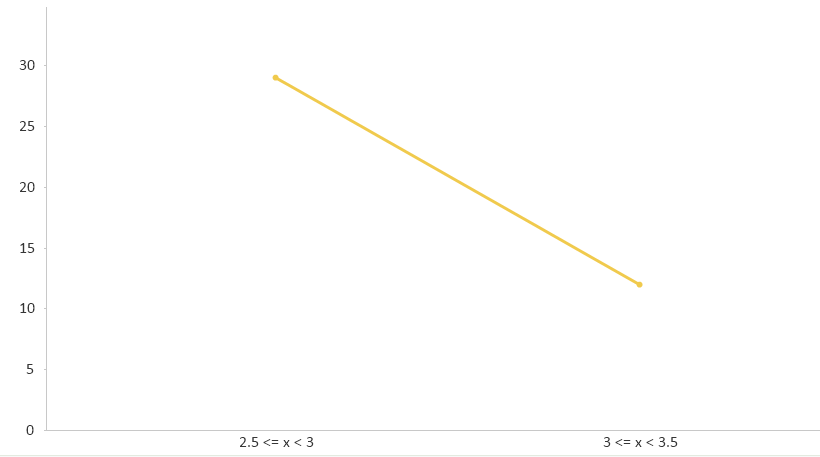
Could someone help point me in the right direction pls?
Thank you soooo much!
- Tags:
- class()
- Mark as New
- Bookmark
- Subscribe
- Mute
- Subscribe to RSS Feed
- Permalink
- Report Inappropriate Content
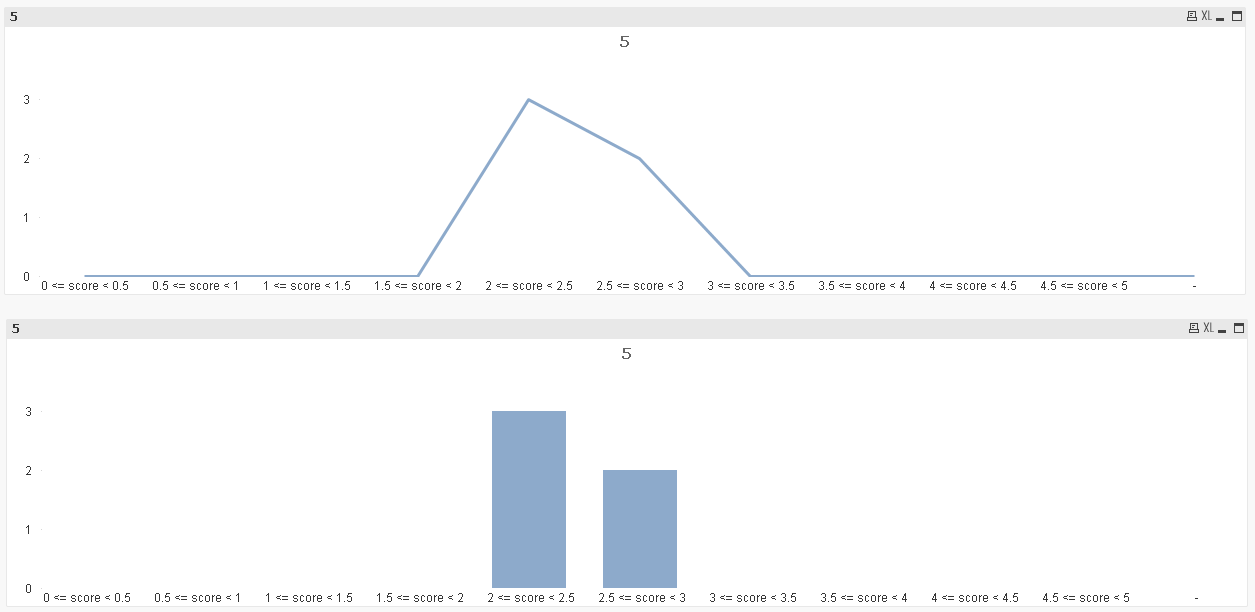
You can populate all possible bucket values in a separated table which is linked to the Score table. You also need to uncheck "Suppress Zero-Value" (Chart Properties > Presentation). See the attached app.
A bar chart would make more sense in this case because line chart draws the line from/ to buckets with zero data.
If a post helps resolve your issue, please mark the answer as correct.
- Mark as New
- Bookmark
- Subscribe
- Mute
- Subscribe to RSS Feed
- Permalink
- Report Inappropriate Content
Hi Vu,
Thank you for your response! In my case having another table will not work as the data is dynamic depending on user selection (i.e. average score in a month, a quarter, a year, etc). So it has to be calculated on the front-end. Do you know of any other workarounds?
- Mark as New
- Bookmark
- Subscribe
- Mute
- Subscribe to RSS Feed
- Permalink
- Report Inappropriate Content
Hi Ninnart, even if the data is dynamic, the buckets 0.0-0.5, 0.5-1.0, ... , 4.5-5.0 are still the same? So this back-end implementation shouldn't affect user selections.
Populating all possible values of score buckets to a separate table is the only solution I could think of. This is very much similar to Master Calendar, where missing transaction dates are handled by generating all dates between MinDate and MaxDate Creating A Master Calendar
If a post helps resolve your issue, please mark the answer as correct.
- Mark as New
- Bookmark
- Subscribe
- Mute
- Subscribe to RSS Feed
- Permalink
- Report Inappropriate Content
Hi Vu,
Ah, I see where you're going with this method. Let me try to give another example.
If I scored 2 in Jan, 3 in Feb, and 4 in Mar... my average score for that quarter would be 3, but my score for the latest month would be 4. The users want to be able to choose the period and the number of test takers' scores should reflect the chosen period.
So each test taker should not be fixed to any bucket in the back-end since that could change depending on the period chosen by the users.
- Mark as New
- Bookmark
- Subscribe
- Mute
- Subscribe to RSS Feed
- Permalink
- Report Inappropriate Content
Hi Ninnart,
In the example I gave, table Score is a transaction table (i.e each row recording one test attempt of one test taker). The idea is to decide the range bucket based on score for each test (statement Floor(Score/0.5)+1 as RangeID; is for that purpose), not fixing the test taker to a bucket.
In this score table, if you add a Date field, users should be able to select this date. Avg score for the selected period is still calculated normally on each bucket.
If a post helps resolve your issue, please mark the answer as correct.
- Mark as New
- Bookmark
- Subscribe
- Mute
- Subscribe to RSS Feed
- Permalink
- Report Inappropriate Content
Hi Vu,
Wouldn't the score of each test be associated to one specific bucket? Sorry I'm still confused. Could you explain a little more?
Going back to my example of Test Taker A,
Jan = 2
Feb = 3
Mar = 4
When I look at his average score by quarter, it should be 3. So he'll fall into 3<= score <3.5 only.
But if I only selected March, his average score will be 4 and he'll fall into 4<= score <4.5 instead.
and if I want to see his performance in the last two months, I'll select Feb and Mar and he'll fall into 3.5<= score < 4.
If i'm understanding your solution correctly, the number of test takers would be duplicated if I select more than 1 month. For example wouldn't Test Taker A fall into 3 buckets if I'm looking at average scores by quarter?
- Mark as New
- Bookmark
- Subscribe
- Mute
- Subscribe to RSS Feed
- Permalink
- Report Inappropriate Content
Hi Ninnart,
I understand your question now. So how do you populate bucket values in the X axis? Do you have score buckets as a calculated dimesion?
It's the best if you can share a sample document with some data.
If a post helps resolve your issue, please mark the answer as correct.