Unlock a world of possibilities! Login now and discover the exclusive benefits awaiting you.
Announcements
FLASH SALE: Save $500! Use code FLASH2026 at checkout until Feb 14th at 11:59PM ET. Register Now!
- Qlik Community
- :
- All Forums
- :
- QlikView App Dev
- :
- Minimum Value in Line chart
Options
- Subscribe to RSS Feed
- Mark Topic as New
- Mark Topic as Read
- Float this Topic for Current User
- Bookmark
- Subscribe
- Mute
- Printer Friendly Page
Turn on suggestions
Auto-suggest helps you quickly narrow down your search results by suggesting possible matches as you type.
Showing results for
Partner - Creator III
2014-12-22
07:22 AM
- Mark as New
- Bookmark
- Subscribe
- Mute
- Subscribe to RSS Feed
- Permalink
- Report Inappropriate Content
Minimum Value in Line chart
Hi,
I have a Line hart where we are values for various months.
All the values are coming between 80% and 100% so that the line which is showing is very clumsy.
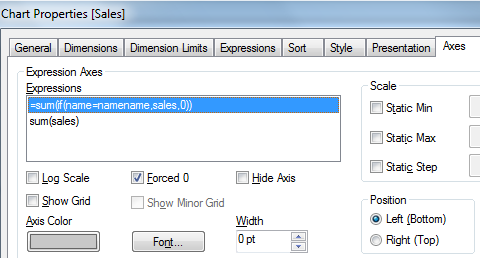
I have to set the minimun value for that line chart,
I have tried giving the option in axes tab setting static min and static max, But thats not working.
Please help.
Thanks in advance
- Tags:
- new_to_qlikview
600 Views
1 Solution
Accepted Solutions
Partner - Master III
2014-12-22
07:24 AM
- Mark as New
- Bookmark
- Subscribe
- Mute
- Subscribe to RSS Feed
- Permalink
- Report Inappropriate Content
493 Views
2 Replies
Partner - Master III
2014-12-22
07:24 AM
- Mark as New
- Bookmark
- Subscribe
- Mute
- Subscribe to RSS Feed
- Permalink
- Report Inappropriate Content
hi
did you unchecked
the force 0 in the axes tab
494 Views
Partner - Creator III
2014-12-22
11:49 PM
Author
- Mark as New
- Bookmark
- Subscribe
- Mute
- Subscribe to RSS Feed
- Permalink
- Report Inappropriate Content
Thank you so much.
It worked 
493 Views