Unlock a world of possibilities! Login now and discover the exclusive benefits awaiting you.
- Qlik Community
- :
- All Forums
- :
- QlikView App Dev
- :
- Multi Dimensional Pivot Chart
- Subscribe to RSS Feed
- Mark Topic as New
- Mark Topic as Read
- Float this Topic for Current User
- Bookmark
- Subscribe
- Mute
- Printer Friendly Page
- Mark as New
- Bookmark
- Subscribe
- Mute
- Subscribe to RSS Feed
- Permalink
- Report Inappropriate Content
Multi Dimensional Pivot Chart
Hi Community.
I have a pivot chart with two dimensions and 3 expressions and I would like to have one dimensions as row and the other as column.
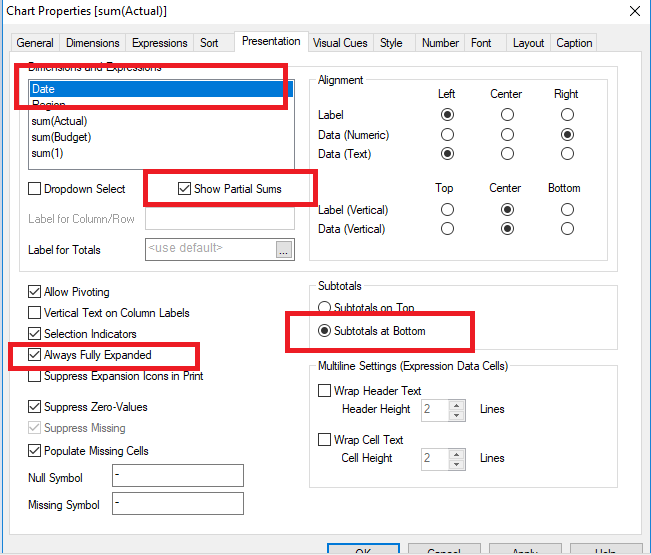
I also have sub totals (partial sums included) in the chart.
Any ideas will be truly greatful
Accepted Solutions
- Mark as New
- Bookmark
- Subscribe
- Mute
- Subscribe to RSS Feed
- Permalink
- Report Inappropriate Content
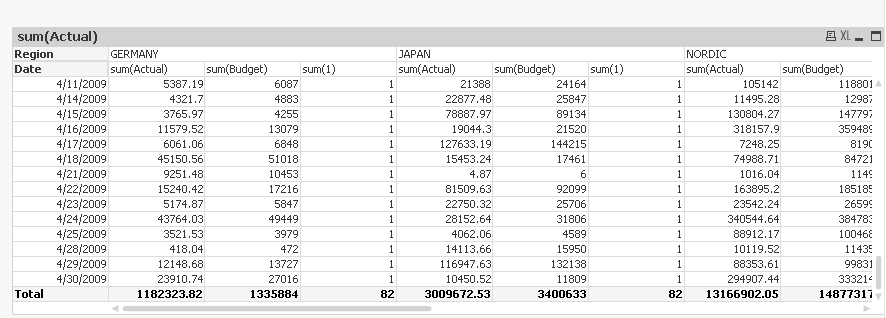
Hi Try like this.
Pull Region to the right and keep above the expression. Please check the attached file as well.
- Mark as New
- Bookmark
- Subscribe
- Mute
- Subscribe to RSS Feed
- Permalink
- Report Inappropriate Content
Hello, Zoe!
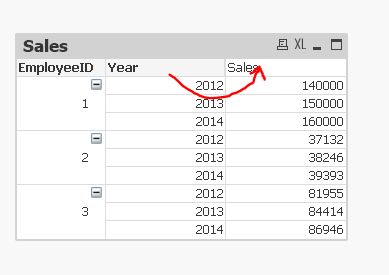
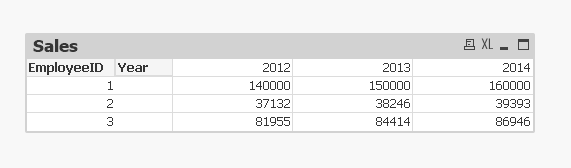
You can drag dimensions in chart from rows to columns by holding the dimension with LMB.
- Mark as New
- Bookmark
- Subscribe
- Mute
- Subscribe to RSS Feed
- Permalink
- Report Inappropriate Content
Hi Zoe,
You just need to drag the second dimension on top of the chart as below example.
- Mark as New
- Bookmark
- Subscribe
- Mute
- Subscribe to RSS Feed
- Permalink
- Report Inappropriate Content
Hi Try like this.
Pull Region to the right and keep above the expression. Please check the attached file as well.
- Mark as New
- Bookmark
- Subscribe
- Mute
- Subscribe to RSS Feed
- Permalink
- Report Inappropriate Content
Thanks for the example Arjun.
The only issue I face is that I have subtotals at the top and when I pull the second dimension to the top it is creating categories based on that dimension.
I may have to look into creating a concat field to illustrate the information from the second dimension in order to keep the format of the chart.