Unlock a world of possibilities! Login now and discover the exclusive benefits awaiting you.
- Qlik Community
- :
- All Forums
- :
- QlikView App Dev
- :
- Multiple Filters on a Pivot Table
- Subscribe to RSS Feed
- Mark Topic as New
- Mark Topic as Read
- Float this Topic for Current User
- Bookmark
- Subscribe
- Mute
- Printer Friendly Page
- Mark as New
- Bookmark
- Subscribe
- Mute
- Subscribe to RSS Feed
- Permalink
- Report Inappropriate Content
Multiple Filters on a Pivot Table
I am trying to filter a pivot table using multiple selections, but I am running in to the issue when I select a value it is the only value displayed in the pivot table.
I have attached a copy of the app I am working on to help find of explain.
What I would like to do is to be able to click on a selection from list 1 and/or 2 & 3 and it filter the Pivot table to only the rows that contain that selection, but keep all of the extra information visible for those rows.
I hope I have explained what I am trying to do with enough detail, if not please let me know further.
Thanks
!
- Mark as New
- Bookmark
- Subscribe
- Mute
- Subscribe to RSS Feed
- Permalink
- Report Inappropriate Content
Hi,
What is meant by additional information? What else should we see after the selection except the selected values in the table?
- Mark as New
- Bookmark
- Subscribe
- Mute
- Subscribe to RSS Feed
- Permalink
- Report Inappropriate Content
List box 1,2,&3 are coming from same table? and if coming from same table then because of data association it will select the associated data.
But while going though your file i'm not able to select 1 & 2 or 3 dimension at the same time means data model or data is not correctly mapped/ there is no associated data . Please check the data model.
- Mark as New
- Bookmark
- Subscribe
- Mute
- Subscribe to RSS Feed
- Permalink
- Report Inappropriate Content
If you select any field it will filter out on that field with all associated values so it is not possible to show other details also with selected result.
If i am not misunderstood you might require this for doing comparative analysis? If yes then For this type of thing you can create one more chart with alternate state which will not change on any selection.
- Mark as New
- Bookmark
- Subscribe
- Mute
- Subscribe to RSS Feed
- Permalink
- Report Inappropriate Content
Hi,
Your data (LB 1, 2, 3...) is not having any connectivity. It doesn't mean that the data model is not good. I can see there is no connectivity in data point of view i.e. May be wrong mapping.
Add 1,2,3 into your pivot and have a look at it, then you can understand your data.
Thanks,
Prashanth Reddy D.
- Mark as New
- Bookmark
- Subscribe
- Mute
- Subscribe to RSS Feed
- Permalink
- Report Inappropriate Content
This might make a bit more sense with semi real data to explain.
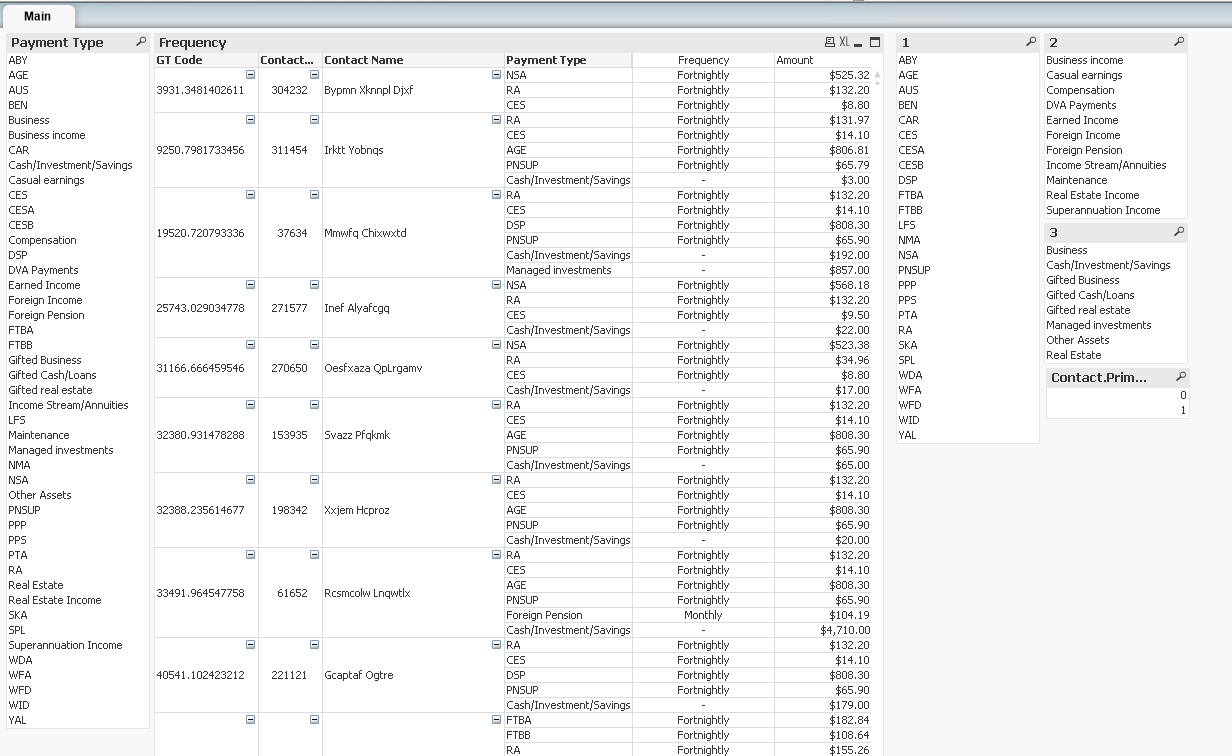
The payment types are all joined from three different SQL tables in to one to produce the Payment Type column. These three SQL tables are also bought in to the app separately to retain the differentiation between Benefit (1)/Income(2)/Other(3).
The mockup below is what I am hoping to achieve (the ////// sections are "filtered out"):
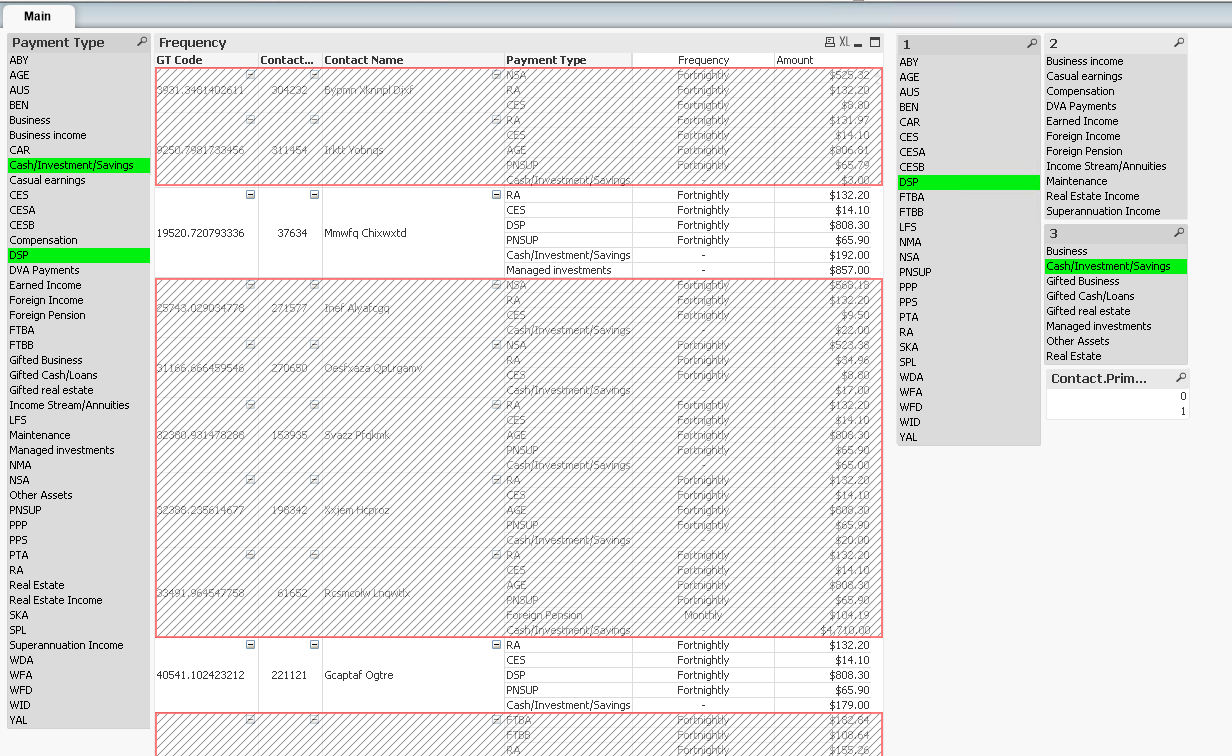
This keeps all records visible for contact 37634 - RA, CES, DSP, PNSUP, Cash/Investment/Savings/Managed Investments and for contact 221121 - RA, CES, DSP, PNSUP, Cash/Investment/Savings as they both contain both selections from LB 1 & 2 and the rest get filtered out as they only contain no or only 1 of the selections.
I am guess I am going to need to do some kind of filtering at [GT Code] level, not [Payment Type] level to retain the extra payment types, but I am completely lost as to how to achieve this.
Thanks again for taking the time to look at this.
Luke
- Mark as New
- Bookmark
- Subscribe
- Mute
- Subscribe to RSS Feed
- Permalink
- Report Inappropriate Content
I have combined 1 2 & 3 to generated the column Payment Type as I do not want 3 separate columns for the data. They are originating from 3 different SQL tables though.