Unlock a world of possibilities! Login now and discover the exclusive benefits awaiting you.
- Qlik Community
- :
- All Forums
- :
- QlikView App Dev
- :
- Multiple reference lines on chart
- Subscribe to RSS Feed
- Mark Topic as New
- Mark Topic as Read
- Float this Topic for Current User
- Bookmark
- Subscribe
- Mute
- Printer Friendly Page
- Mark as New
- Bookmark
- Subscribe
- Mute
- Subscribe to RSS Feed
- Permalink
- Report Inappropriate Content
Multiple reference lines on chart
Hi,
to display multiple lines that depend on the values of a field I found this solution, but I do not know the number of possible values. With this solution I have to manually enter the number of lines to display. There are other ways to view these reference lines?
Thanks in advance
- Mark as New
- Bookmark
- Subscribe
- Mute
- Subscribe to RSS Feed
- Permalink
- Report Inappropriate Content
Can you not add LEVEL as a third dimension? If not, a common cheat is to create another chart with LEVEL as the dimension and place it over or under the first chart, making one of them transparent...
- Mark as New
- Bookmark
- Subscribe
- Mute
- Subscribe to RSS Feed
- Permalink
- Report Inappropriate Content
Hi Jason,
if I add the third dimension i get a new group to filter the sum(value), but i don't see any costant level on chart. Can you explain with an example your solution?
Thanks.
I post my test script.
LOAD * INLINE [
MONTH, LEVEL, GROUOP, VALUE
01, 30, AA, 1
02, 30, AA,2
03, 30, AA,3
04, 30, AA,4
05, 30, AA,5
06, 30, AA,6
07, 30, AA,7
08, 30, AA,1
09, 30, AA,3
10, 30, AA,5
11, 30, AA,2
12, 30, AA,4
01, 50, AA,5
02, 50, AA,4
03, 50, AA,1
04, 50, AA,1
05, 50, AA,1
06, 50, AA,1
07, 50, AA,1
08, 50, AA,1
09, 50, AA,1
10, 50, AA,1
11, 50, AA,1
12, 50, AA,1
01, 70, AA,1
02, 70, AA,1
03, 70, AA,1
04, 70, AA,1
05, 70, AA,1
06, 70, AA,1
07, 70, AA,1
08, 70, AA,1
09, 70, AA,1
10, 70, AA,1
11, 70, AA,1
12, 70, AA,1
];
- Mark as New
- Bookmark
- Subscribe
- Mute
- Subscribe to RSS Feed
- Permalink
- Report Inappropriate Content
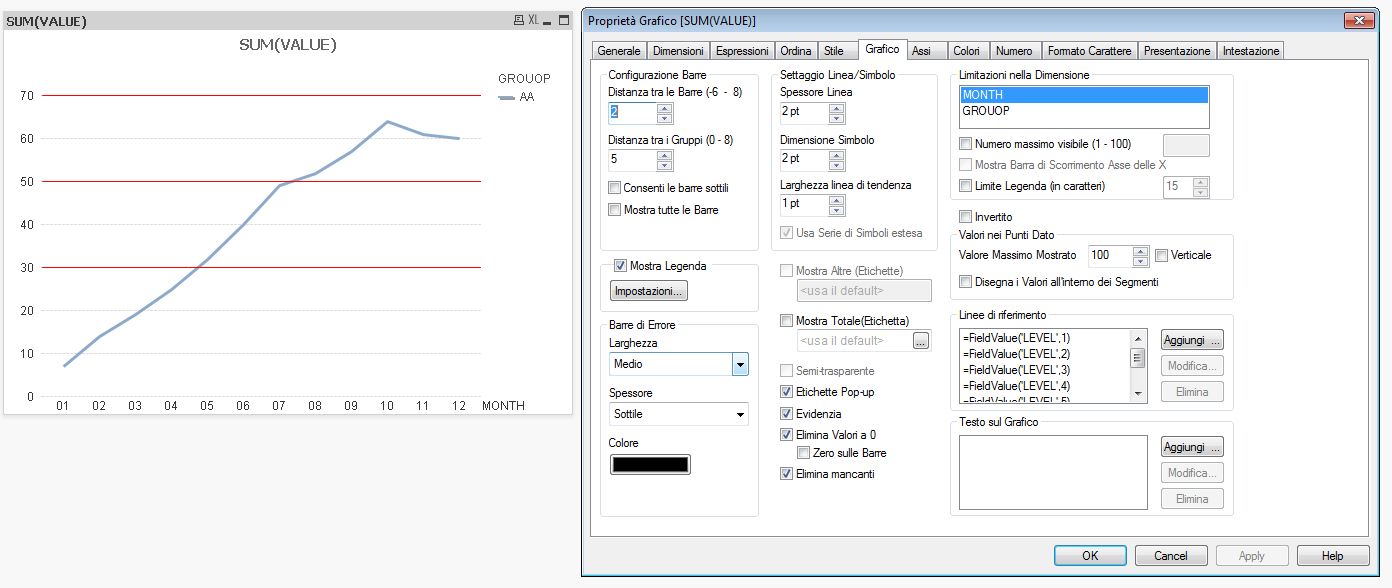
I'm sure you can do this in some cleverer way but here's the cheat I was telling you about. Note the Static Max on the Axis to ensure both charts always have the same scale.
Hope it helps,
Jason
- Mark as New
- Bookmark
- Subscribe
- Mute
- Subscribe to RSS Feed
- Permalink
- Report Inappropriate Content
Hi Jason, thanks for your solution.
I collect three solutions in the follow QVW, one of them doesn't show all level values (I'd like to know why).
I'd like to use third dimension to show the level reference lines.
Anyone can help me?