Unlock a world of possibilities! Login now and discover the exclusive benefits awaiting you.
- Qlik Community
- :
- All Forums
- :
- QlikView App Dev
- :
- NPrinting
- Subscribe to RSS Feed
- Mark Topic as New
- Mark Topic as Read
- Float this Topic for Current User
- Bookmark
- Subscribe
- Mute
- Printer Friendly Page
- Mark as New
- Bookmark
- Subscribe
- Mute
- Subscribe to RSS Feed
- Permalink
- Report Inappropriate Content
NPrinting
Can anyone explain me with steps needed to create a pixel perfect report in NPrinting.
I am trying to display a straight table in PDF reports.
I have more than 100 rows in the straight table. I am trying to display to all the rows in PDF file.
- Tags:
- new_to_qlikview
- Mark as New
- Bookmark
- Subscribe
- Mute
- Subscribe to RSS Feed
- Permalink
- Report Inappropriate Content
Refer How to Create a Simple PixelPerfect Report – Customer Feedback for Vizubi
Create New PixelPerfect Report
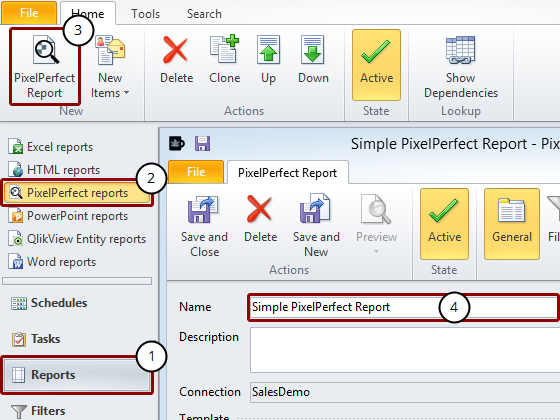
Run NPrinting and open the project C:\NPrintingTraining\NPrintingFiles\NPrintingTraining.nsq
- Click on Reports
- Select PixelPerfect reports
- Click on the PixelPerfect Report button to create a new one
- Enter Simple PixelPerfect Report as the report Name
Create New PixelPerfect Report Template
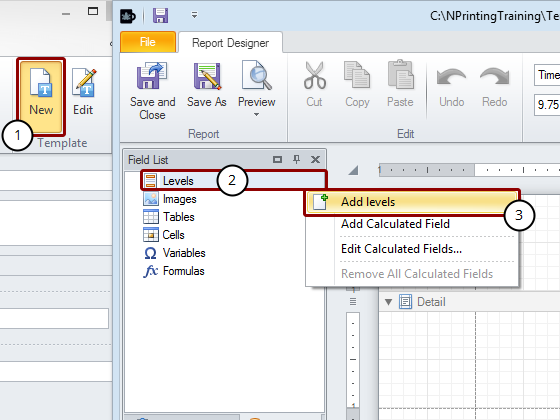
- Click on New to open a blank template in the Template Editor
- Right click on the Levels node to add a level
- Select the Add levels option
Insert QlikView Table as Level
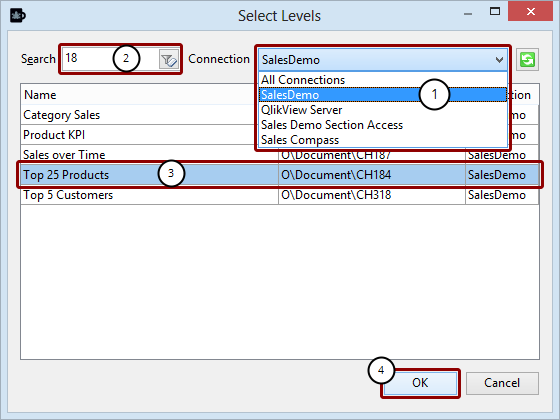
- Select the Connection to the QlikView document that contains the object you want
- Enter '1' and '8' into the search field and the number of candidate objects is reduced to five
- If Top 25 Products - CH184 is the only object visible, press Enter to add it into the Levels node, otherwise select it in the list
- Click on the OK button
Create Level Details
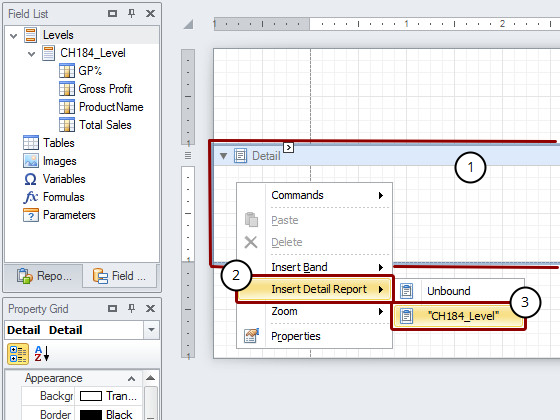
- Right click on the Detail area in the middle of the page
- Select Insert Detail Report
- Choose "CH184_Level" from the list
Create Data Columns
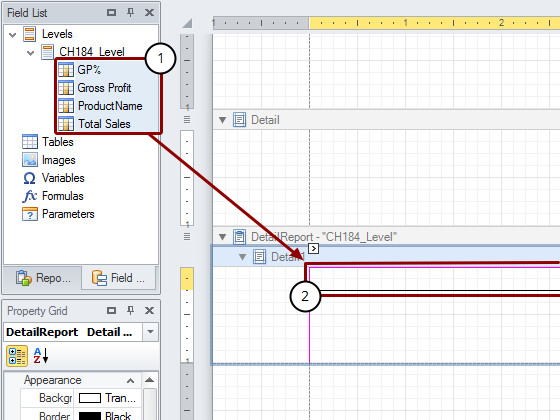
- Press SHIFT or CTRL and select the four columns of the CH184 from the Levels node
- Drag and drop them into the DetailReport - "CH184_Level" area
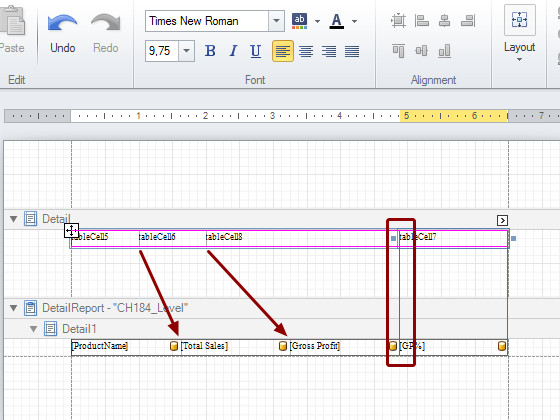
Set Column Order
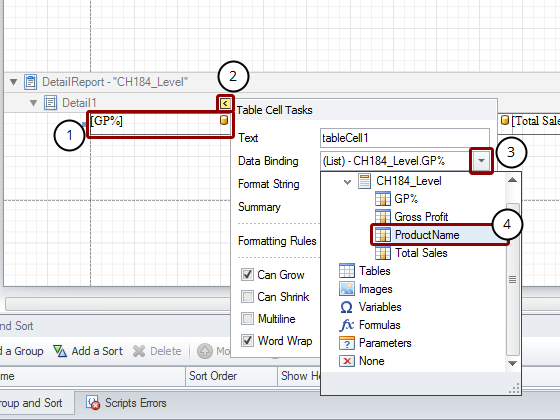 To change the order of the columns:
- Click in a cell to select it, for instance the first GP%
- Click on the small arrow that appears at the upper right corner, this opens the Table Cell Tasks menu
- Open the Data Binding drop down menu and expand the CH184_Level.GP% node
- Select Product Name to set this field as first column
- Repeat 1 through 4 for the other columns in the order Total Sales, Gross Profit and GP%
Adjust inter-Row White Space
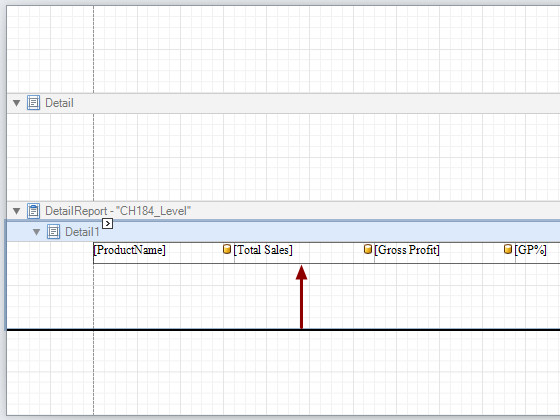 To eliminate inter-row white space, select the dotted line below the table and overlap it with the bottom line of the CH184_level table.
Create Table Headings
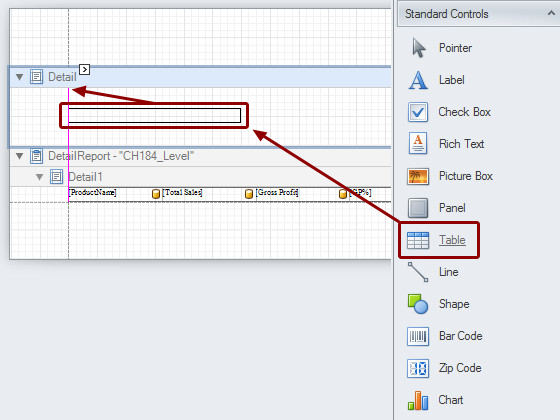 Drag and drop the Table object from the Tool Box on the right to add column headings. Align the new table with the upper left corner of the Detail area.
Insert a Fourth Column
 It is necessary to create a new column to match the data structure:
- Right click on the third cell
- Select Insert
- Click on Column to Left
Column Alignment
 Select the right border of the third cell and drag it until the guideline overlaps with the right border of the third cell of the CH184_Level table. Repeat this action with the other cells until they are aligned with the corresponding cells in theCH184_Level table.
Enter Column Heading Text
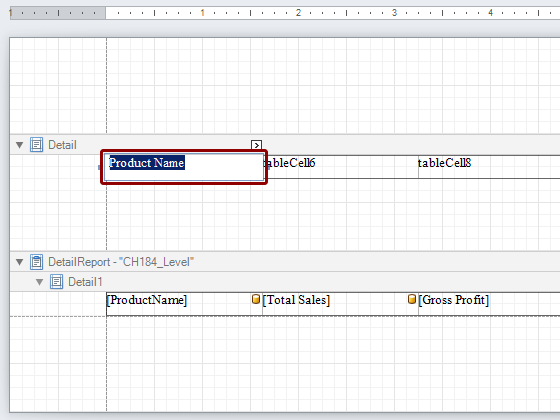
- Double click on the first column on the left to edit the text and enter Product Name
- Repeat the process with the second column and enter Total Sales
- Enter Gross Profit in the third cell and Gross Profit % in the last one
Table Heading Text Format
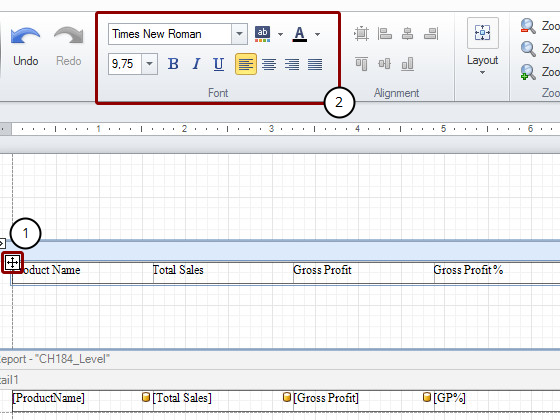
- Select the entire table by clicking on the upper left corner
- Set the font type, dimension, alignment, etc. as you prefer. For instance select sans serif, 14px, Bold and Centered
Table Borders
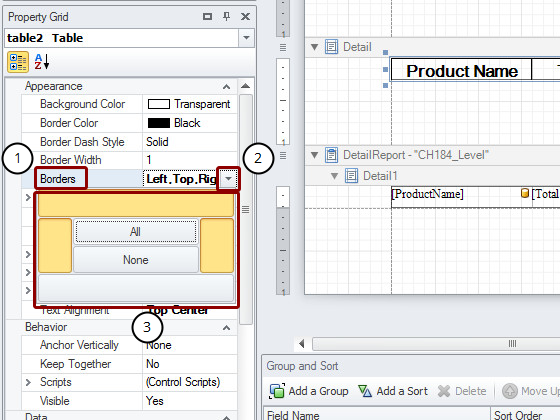
- Select the row of table headings and then find Borders in the Property Grid in the lower left corner
- Click on the drop down menu
- Click on All, then click on the bottom border to remove it
Eliminate Empty Space between Headings and Data
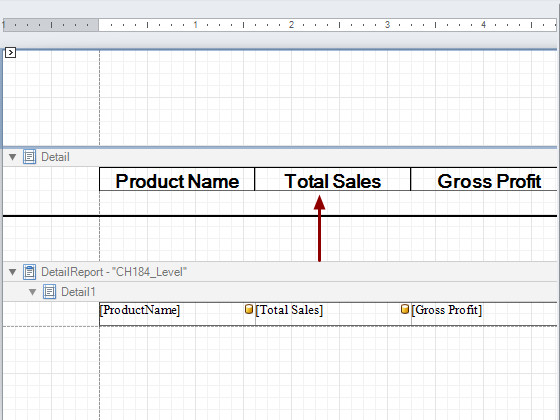 Select the bottom border of the Detail area and align it with the bottom border of the table to eliminate the empty space.
Set Table Data Borders
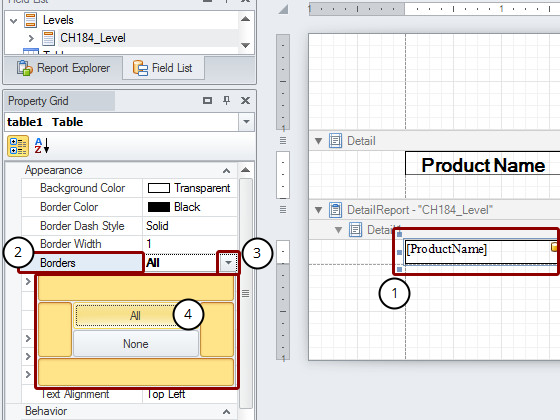
- Select the entire data table in the DetailReport - "CH184_Level" area
- Find Borders in the Property Grid
- Open the drop down menu
- Select All and the Border icons become yellow
Format Data Fonts
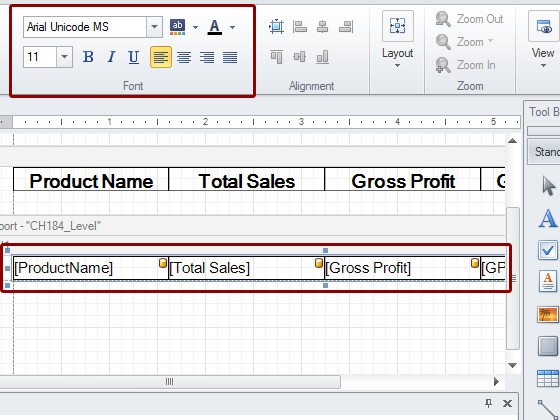
- Keep the data table selected
- Set the font format you prefer. For instance select sans serif, 11px
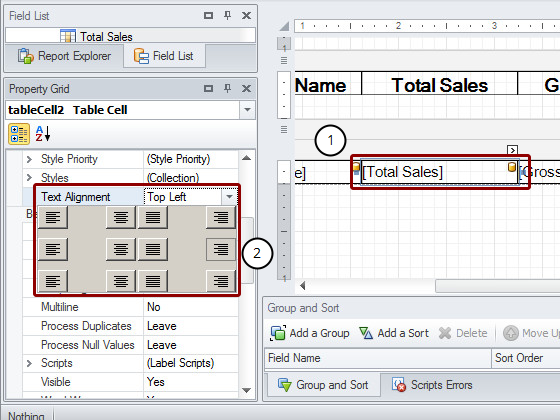
Set Data Alignment
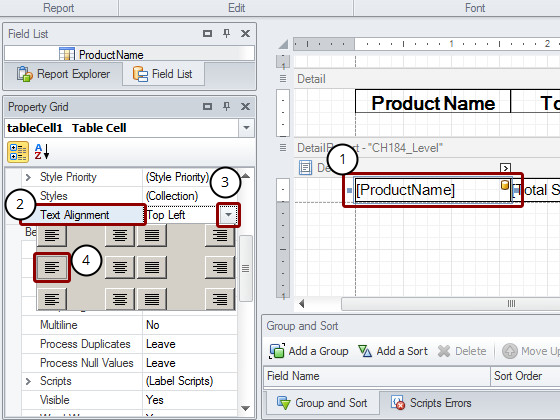
- Select the ProductName cell
- Find "Text Alignment" in the Property Grid
- Click on the drop down menu
- Set text alignment to Middle Left
Finish Data Alignment
- Select the Total Sales cell
- Set text alignment to Middle Right in the Property Grid
- Repeat steps 1 and 2 for columns Gross Profit and Gross Profit %
Format Numbers
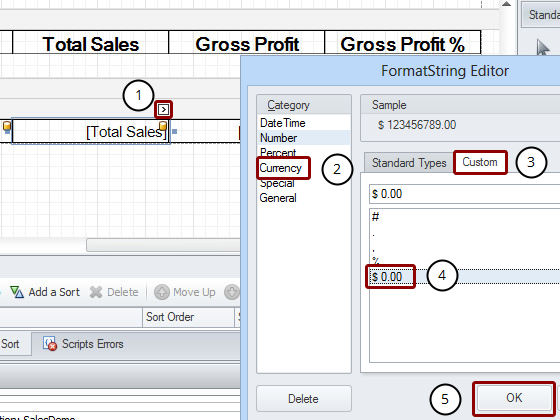 Set the number formatting to Dollar currency by:
- Select the cell Total Sales and click on the upper right arrow ">"
- Click on the dots on the right of Format String in the new window, then select Currency
- Click on the Custom tab
- Select the $0.00 format
- Confirm with OK.
- Repeat steps 1 to 5 for the Gross Profit cell
- Format Gross Profit % as Percent 0.00%
Save the Template
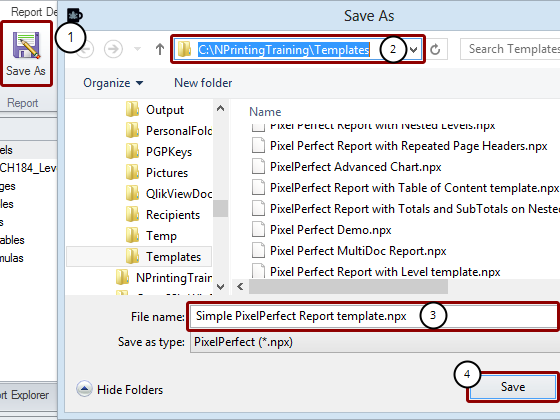
- Click on the Save As icon in the Report group of the tool bar
- Make sure that the Save As window is set to save in the C:\NPrintingTraining\Templates folder
- Enter Simple PixelPerfect Report template.npx
- Click on the Save button
Report Preview
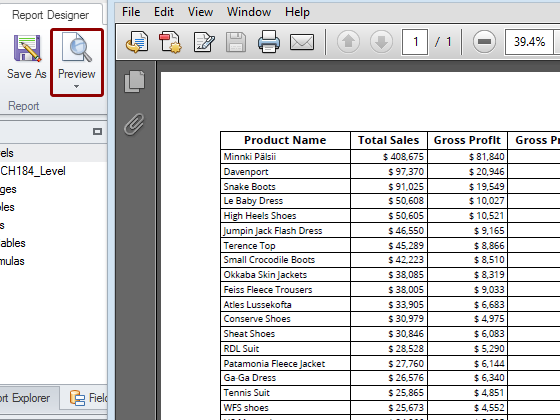
Click on the Preview icon to see the final report.
- Mark as New
- Bookmark
- Subscribe
- Mute
- Subscribe to RSS Feed
- Permalink
- Report Inappropriate Content
Please, check the correct answer.
thank you