Unlock a world of possibilities! Login now and discover the exclusive benefits awaiting you.
Announcements
FLASH SALE: Save $500! Use code FLASH2026 at checkout until Feb 14th at 11:59PM ET. Register Now!
- Qlik Community
- :
- All Forums
- :
- QlikView App Dev
- :
- Re: Need Help for Y axis values
Options
- Subscribe to RSS Feed
- Mark Topic as New
- Mark Topic as Read
- Float this Topic for Current User
- Bookmark
- Subscribe
- Mute
- Printer Friendly Page
Turn on suggestions
Auto-suggest helps you quickly narrow down your search results by suggesting possible matches as you type.
Showing results for
Contributor III
2018-05-22
08:57 PM
- Mark as New
- Bookmark
- Subscribe
- Mute
- Subscribe to RSS Feed
- Permalink
- Report Inappropriate Content
Need Help for Y axis values
Hello,
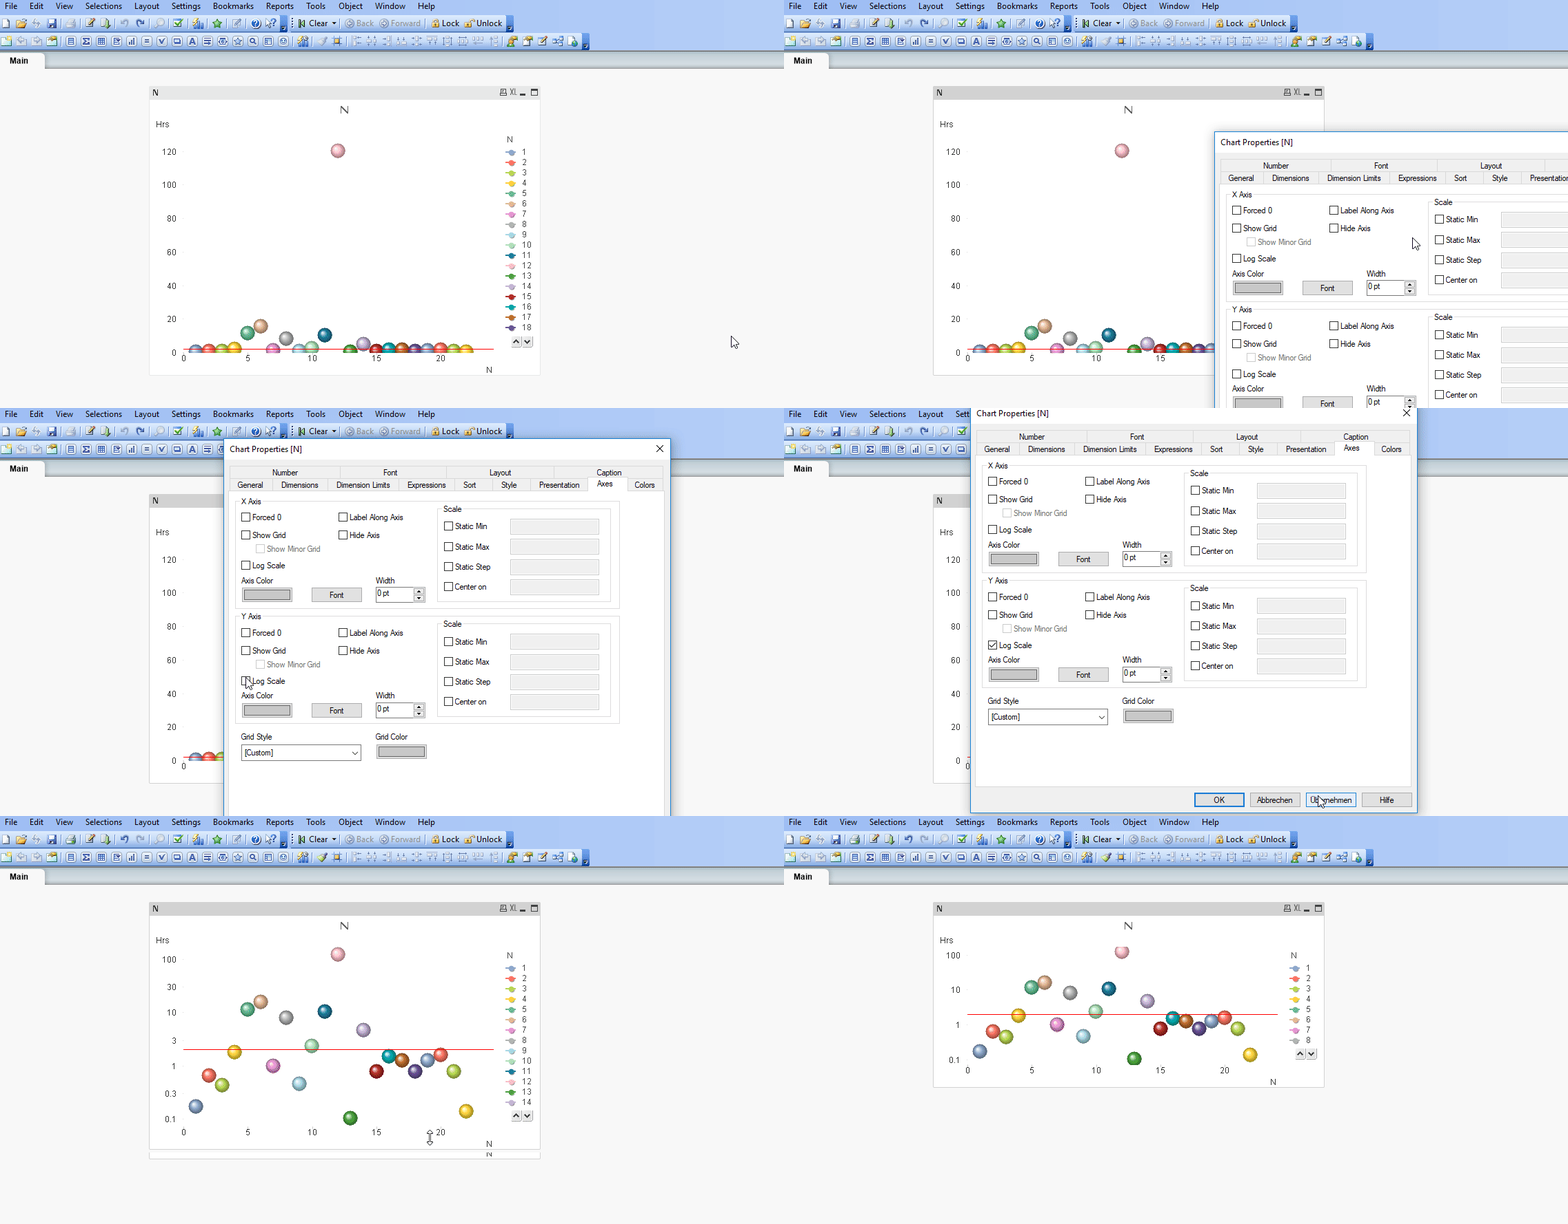
I am looking for my scatter chart Y- axis value range like 0.1,1.0,10, 100,1000.etc.
For example if the hour is equal to 2 hrs, it should show between 1 to 10 range. So how to setup the multi range y axis for My chart. I want my output should look like the attached excel chart.
Can you please help me on this. Please find the attached qvw and let me know if you have any questions.
Regards,
Pinky
1,221 Views
5 Replies
2018-05-23
12:07 AM
- Mark as New
- Bookmark
- Subscribe
- Mute
- Subscribe to RSS Feed
- Permalink
- Report Inappropriate Content
Can you check once this Time Bucket for Hour
Best Anil, When applicable please mark the correct/appropriate replies as "solution" (you can mark up to 3 "solutions". Please LIKE threads if the provided solution is helpful
1,125 Views
Contributor II
2018-05-23
08:49 AM
- Mark as New
- Bookmark
- Subscribe
- Mute
- Subscribe to RSS Feed
- Permalink
- Report Inappropriate Content
I am unable to achieve in my scenario. can you please send me the sample qvw to achieve buckets on Y -axis.
Thanks,
Pinky
1,125 Views
Employee
2018-05-23
09:02 AM
- Mark as New
- Bookmark
- Subscribe
- Mute
- Subscribe to RSS Feed
- Permalink
- Report Inappropriate Content
Enable "Log Scale" for the Y-axis.
Master II
2018-05-23
10:05 AM
- Mark as New
- Bookmark
- Subscribe
- Mute
- Subscribe to RSS Feed
- Permalink
- Report Inappropriate Content

Master II
2018-05-23
10:19 AM
- Mark as New
- Bookmark
- Subscribe
- Mute
- Subscribe to RSS Feed
- Permalink
- Report Inappropriate Content
Nice franky_h79
1,125 Views