Unlock a world of possibilities! Login now and discover the exclusive benefits awaiting you.
- Qlik Community
- :
- All Forums
- :
- QlikView App Dev
- :
- Need Help for chart
- Subscribe to RSS Feed
- Mark Topic as New
- Mark Topic as Read
- Float this Topic for Current User
- Bookmark
- Subscribe
- Mute
- Printer Friendly Page
- Mark as New
- Bookmark
- Subscribe
- Mute
- Subscribe to RSS Feed
- Permalink
- Report Inappropriate Content
Need Help for chart
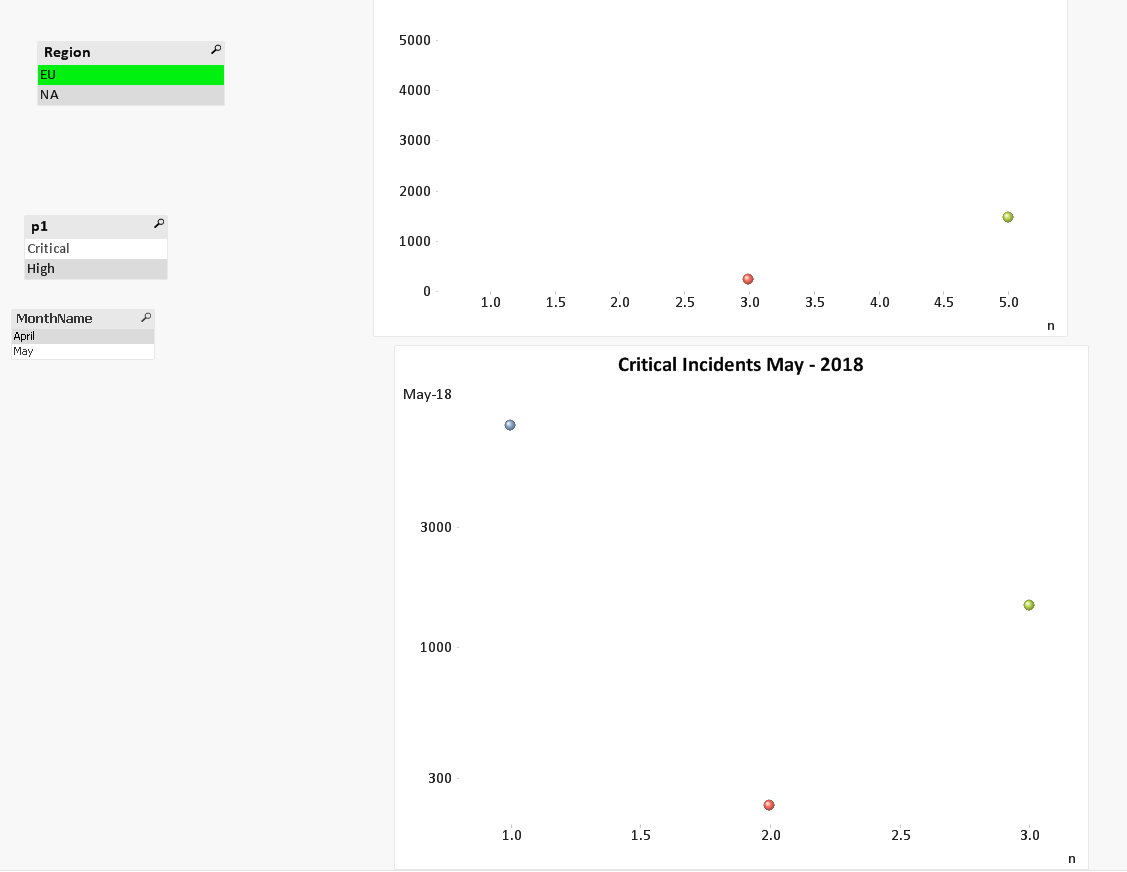
I have data for different regions, year, group etc.. Asia, Europe and North America. I am using scatter chart and Row No() as Dimension and Hours is measure. When i use Row no() in qlikview it sequentially assigning the row number. when i filter it based on region, my chart is showing the Row No() as per initial assignment like 1,5,8 etc. I want my Row no() to display sequentially like 1,2, 3..etc whenever i use filter. In other words, i want to override the initial Row no() assigned by qlikview and make it sequential for any filter.
If you see the attached screenshot, for one of region, You see dots and spaces because of Row no() assigned. So i want to make it sequential for any filter so that dots will spread across the chart. Please let me know if you have any question. I appreciate your help!
Thanks!
Accepted Solutions
- Mark as New
- Bookmark
- Subscribe
- Mute
- Subscribe to RSS Feed
- Permalink
- Report Inappropriate Content
1st of all, you (sweety0912) and pinky1234 work together? Just want to make sure when you say I, you are looking at the same thing as pink P 
2nd, so you need a dynamic count... may be just use =RowNo(TOTAL) in the chart instead of n...
- Mark as New
- Bookmark
- Subscribe
- Mute
- Subscribe to RSS Feed
- Permalink
- Report Inappropriate Content
Do you have a sample data?
- Mark as New
- Bookmark
- Subscribe
- Mute
- Subscribe to RSS Feed
- Permalink
- Report Inappropriate Content
Please find the attached Qvw. If i select region='EU' you see the data Rowno() 1,3,5..etc. But what i want is for any filter, Rowno() should be sequential.like 1,2,3..etc. Need to override the initial rowno() assigned by qlikview.
Please help me on this?
- Mark as New
- Bookmark
- Subscribe
- Mute
- Subscribe to RSS Feed
- Permalink
- Report Inappropriate Content
Sorry I do not have paid version of QlikView. I can on see the back end...
Can you upload the sample data?
Or maybe someone who has Qlikview full version can help?
- Mark as New
- Bookmark
- Subscribe
- Mute
- Subscribe to RSS Feed
- Permalink
- Report Inappropriate Content
PFA the Excel file and here is the script used
Data:
LOAD MonthName,
Priority,
Group,
Region,
Hours
FROM
(ooxml, embedded labels, table is Sheet1);
Test2:
LOAD Priority as p1,
Group,
MonthName,
Region,
RowNo() as n,
Hours as hrs1
Resident Data;
DROP Table Data;
- Mark as New
- Bookmark
- Subscribe
- Mute
- Subscribe to RSS Feed
- Permalink
- Report Inappropriate Content
Are you looking for this n to be calculated in the script for each Region?
- Mark as New
- Bookmark
- Subscribe
- Mute
- Subscribe to RSS Feed
- Permalink
- Report Inappropriate Content
I am using Rowno() as dimension. If i click any filter Rowno() should be sequential.like 1,2,3..etc. Need to override the initial rowno() assigned by qlikview.
For ex: if you click EU region you see the dots for 1,3,5 rowno() but i want sequential like1,2,3 etc for any filter i choose from left side.
- Mark as New
- Bookmark
- Subscribe
- Mute
- Subscribe to RSS Feed
- Permalink
- Report Inappropriate Content
1st of all, you (sweety0912) and pinky1234 work together? Just want to make sure when you say I, you are looking at the same thing as pink P
2nd, so you need a dynamic count... may be just use =RowNo(TOTAL) in the chart instead of n...
- Mark as New
- Bookmark
- Subscribe
- Mute
- Subscribe to RSS Feed
- Permalink
- Report Inappropriate Content
Thank you so much Sunny! This is exactly what i want.
One more question. If you see the y-axis range 1000,2000,3000,..8000 etc. I want it like 0,100,200,300 to 1000,2K,3K to 8K. Becasue hours are more in 0 to 1000 range. I have tried log scale for Y-Axis. Log scale is not working for Y axis it is working for X-axis.I am expecting to work for Y-axis. Can you help me on this?
- Mark as New
- Bookmark
- Subscribe
- Mute
- Subscribe to RSS Feed
- Permalink
- Report Inappropriate Content
It seems to be doing something when I select the log scale for y axis...
What are you seeing when you select log scale for y axis?