Unlock a world of possibilities! Login now and discover the exclusive benefits awaiting you.
Announcements
Join us to spark ideas for how to put the latest capabilities into action. Register here!
- Qlik Community
- :
- All Forums
- :
- QlikView App Dev
- :
- Need to display the Top 5 Amount for that Year in ...
Options
- Subscribe to RSS Feed
- Mark Topic as New
- Mark Topic as Read
- Float this Topic for Current User
- Bookmark
- Subscribe
- Mute
- Printer Friendly Page
Turn on suggestions
Auto-suggest helps you quickly narrow down your search results by suggesting possible matches as you type.
Showing results for
Not applicable
2012-07-25
07:18 AM
- Mark as New
- Bookmark
- Subscribe
- Mute
- Subscribe to RSS Feed
- Permalink
- Report Inappropriate Content
Need to display the Top 5 Amount for that Year in the report
Hi,
These are the Column names(DataSource):
CUSTOMER NAME
USER ID
LOCATION
SCHEME
CIRCLE
ZONE
TARRIF AMOUNT
NO OF MONTHS
ACTIVATION_DATE
EXPIRY_DATE
AVERAGE AMOUNT
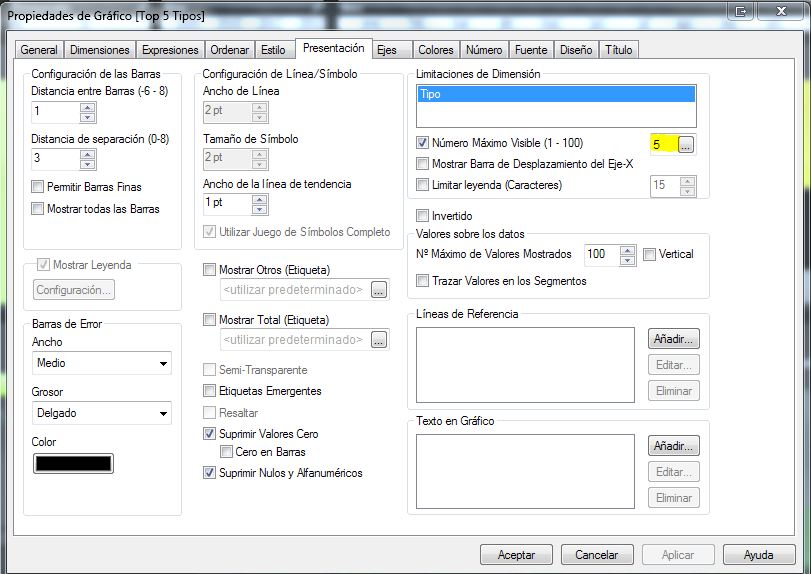
Based on "CIRCLE" (filter condition) i need to display the Top 5 Average Amount of SCHEME for that Year.
How to achieve this?
- Tags:
- new_to_qlikview
610 Views
3 Replies
Partner - Creator III
2012-07-25
07:22 AM
- Mark as New
- Bookmark
- Subscribe
- Mute
- Subscribe to RSS Feed
- Permalink
- Report Inappropriate Content
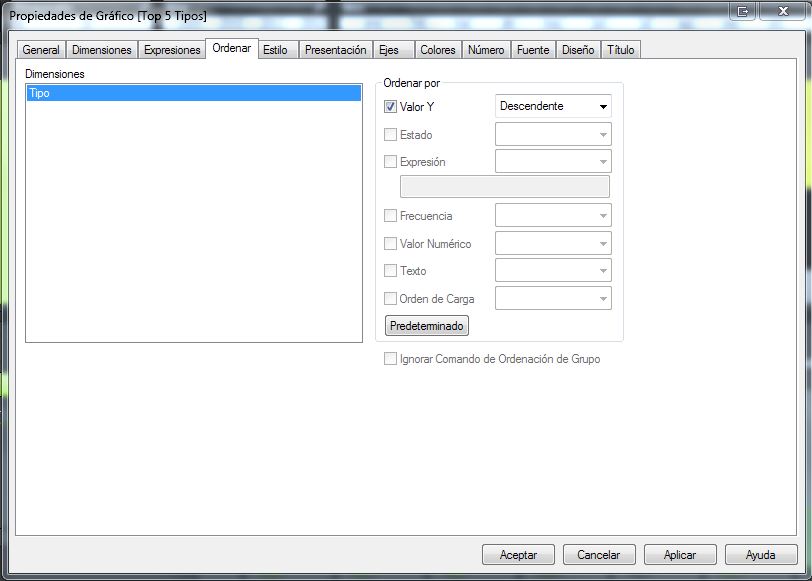
in the GUI build a calculated dimension using the function rank
hector
438 Views
Not applicable
2012-07-25
08:16 AM
Author
- Mark as New
- Bookmark
- Subscribe
- Mute
- Subscribe to RSS Feed
- Permalink
- Report Inappropriate Content
Hi,
You can do that using chart properties, on presentación tab, and ordering the expresión result.
I hope help you
438 Views
Not applicable
2012-08-01
08:54 AM
Author
- Mark as New
- Bookmark
- Subscribe
- Mute
- Subscribe to RSS Feed
- Permalink
- Report Inappropriate Content
Hope below post helps!
438 Views