Unlock a world of possibilities! Login now and discover the exclusive benefits awaiting you.
- Qlik Community
- :
- All Forums
- :
- QlikView App Dev
- :
- Need to display y-axis numbers on both sides in ba...
- Subscribe to RSS Feed
- Mark Topic as New
- Mark Topic as Read
- Float this Topic for Current User
- Bookmark
- Subscribe
- Mute
- Printer Friendly Page
- Mark as New
- Bookmark
- Subscribe
- Mute
- Subscribe to RSS Feed
- Permalink
- Report Inappropriate Content
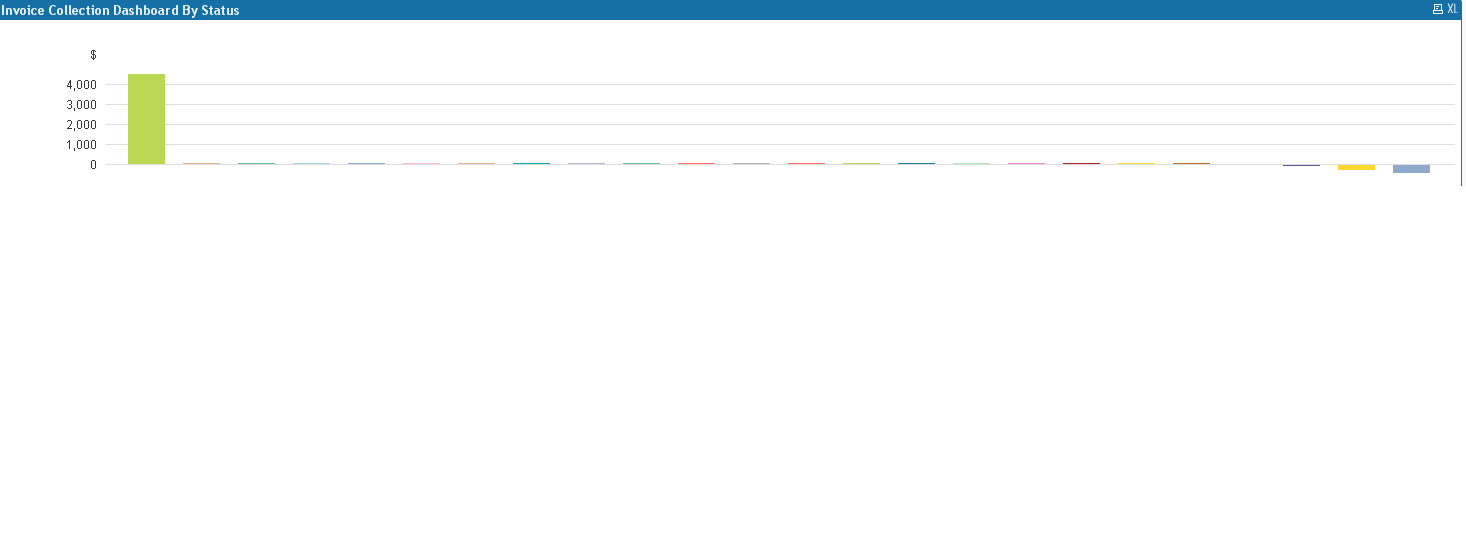
Need to display y-axis numbers on both sides in bar chart
Hi All,
I have an requirement that as you can see in the below image.
I have created an Bar chart and had Y-axis numbers as 0,1000,2000. Now the same i want to display the same axis numbers in both ends of the bar chart. Is it possible?
I have two expression one expression is selected with bar and second expression is selected with text as pop-up. Please let me know how can i achieve it.

Attached image for your reference.
Thanks,
Bharat
- « Previous Replies
-
- 1
- 2
- Next Replies »
Accepted Solutions
- Mark as New
- Bookmark
- Subscribe
- Mute
- Subscribe to RSS Feed
- Permalink
- Report Inappropriate Content
- Mark as New
- Bookmark
- Subscribe
- Mute
- Subscribe to RSS Feed
- Permalink
- Report Inappropriate Content
I don't think you can do that without a second expression that is plotted on the chart (not just text). You will need to create another expression that is linked to the RHS axis. Use a combo chart, and a symbol for the second expression. Make the symbol small or colour it to make it invisible (or at least unobtrusive).
- Mark as New
- Bookmark
- Subscribe
- Mute
- Subscribe to RSS Feed
- Permalink
- Report Inappropriate Content
I thnk it is not psble
- Mark as New
- Bookmark
- Subscribe
- Mute
- Subscribe to RSS Feed
- Permalink
- Report Inappropriate Content
You can get something along those lines if you copy the bar expression and on the axis tab assign it the Right position. You can set the background color of that expression to 100% transparent so you don't see the bar. That way you'll get the same axis on the right as well. The disadvantage is that you have a bit of empty space on the right side of the bar that is visible.
edit: like Jonathan said. Use a combi chart. You can set the background color of the symbol expression to 100% transparent and disable the Expressions as Legend setting too.
talk is cheap, supply exceeds demand
- Mark as New
- Bookmark
- Subscribe
- Mute
- Subscribe to RSS Feed
- Permalink
- Report Inappropriate Content
Hi Jonathan,
Thanks for your reply.
I have 2 expressions in bar chart. Sorry to say that I need to do in bar chart not in any other chart.
- Mark as New
- Bookmark
- Subscribe
- Mute
- Subscribe to RSS Feed
- Permalink
- Report Inappropriate Content
Why not? The result of the combi chart will still look exactly like a bar chart.
talk is cheap, supply exceeds demand
- Mark as New
- Bookmark
- Subscribe
- Mute
- Subscribe to RSS Feed
- Permalink
- Report Inappropriate Content
I think you are missing the point. If you want a second axis, you will need an expression that is plotted on that axis. Both gysbert's suggestion and mine are ways to make this additional expression as invisible as possible. But without it, you cannot get both axes.
- Mark as New
- Bookmark
- Subscribe
- Mute
- Subscribe to RSS Feed
- Permalink
- Report Inappropriate Content
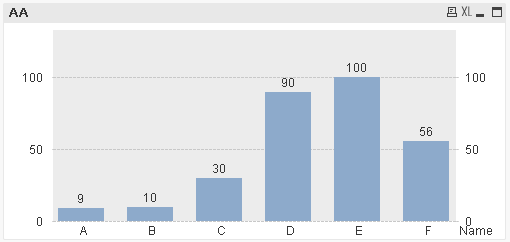
Hi Gysbert,
Please find the below image:
In the left hand side you can see the axis numbers as 0,1000. It is in left hand side. Now the same axis with numbers i need to display right hand side. I need to see the axis numbers on both sides of the chart.
Thanks.
- Mark as New
- Bookmark
- Subscribe
- Mute
- Subscribe to RSS Feed
- Permalink
- Report Inappropriate Content
Hi,
Try adding the same expression again and select Right axes in axes tab for the second expression.
Regards,
Jagan.
- Mark as New
- Bookmark
- Subscribe
- Mute
- Subscribe to RSS Feed
- Permalink
- Report Inappropriate Content
Check the attached sample.
- « Previous Replies
-
- 1
- 2
- Next Replies »