Unlock a world of possibilities! Login now and discover the exclusive benefits awaiting you.
- Qlik Community
- :
- All Forums
- :
- QlikView App Dev
- :
- Need to hide bars with zero value
- Subscribe to RSS Feed
- Mark Topic as New
- Mark Topic as Read
- Float this Topic for Current User
- Bookmark
- Subscribe
- Mute
- Printer Friendly Page
- Mark as New
- Bookmark
- Subscribe
- Mute
- Subscribe to RSS Feed
- Permalink
- Report Inappropriate Content
Need to hide bars with zero value
Hi everyone! I am relatively new to qlikview and have a question about hiding the "bars" and axis labels which have zero/null value...
no other answers have worked because my data is set up in an unique way. 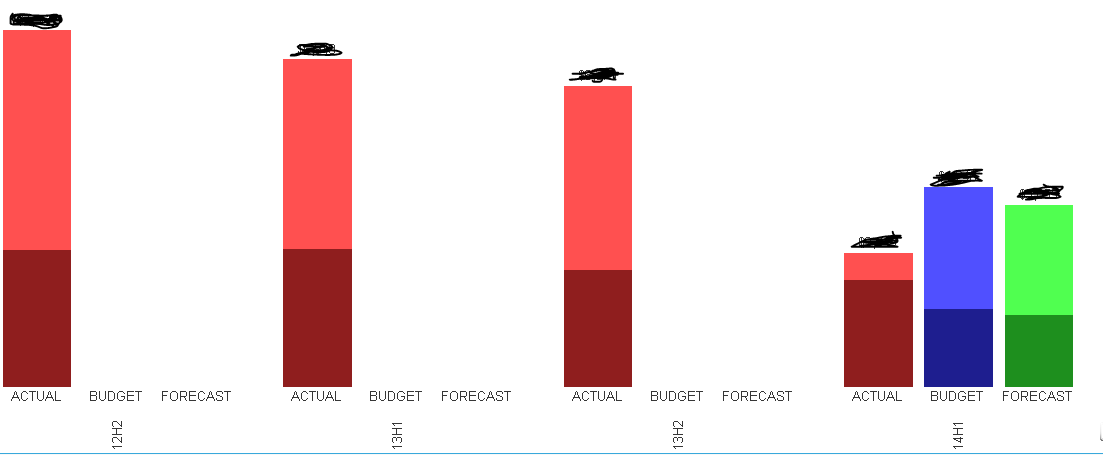
I need to hide the budget and forecast from 12h2 through 13h2 so that there is no empty space in my graph. Since no data is available for Budget and Forecast through 12h2 through 13h2, there is this weird empty space but on 14h1, since there is data for all three, it looks full.
Any help is GREATLY appreciated.
and no.... checking supress zero values doesn't do anything....
Please look at Distribution 2 and Result Table for the empty bars chart. I need to remove those empty spaces (bars) with zero values.
- « Previous Replies
- Next Replies »
- Mark as New
- Bookmark
- Subscribe
- Mute
- Subscribe to RSS Feed
- Permalink
- Report Inappropriate Content
Hi Rob,
Thank you so much. I knew this way but it makes the chart look a bit odd. The Hierarchy of Quarters to Years or Vice Versa is gone when you combine the dimensions. Hence am restraining from going that route 😐
- Mark as New
- Bookmark
- Subscribe
- Mute
- Subscribe to RSS Feed
- Permalink
- Report Inappropriate Content
Thanks, I had the same doubt, and it worked for me.
- Mark as New
- Bookmark
- Subscribe
- Mute
- Subscribe to RSS Feed
- Permalink
- Report Inappropriate Content
sol:
use the cal dimension for actuals, forecast and budget in your chart,
if(isnull(aggr(sum(yourexpression for actuals or for or bud),dim))=0,dim)
here:dim=12H2 ...etc
it should work.
- « Previous Replies
- Next Replies »