Unlock a world of possibilities! Login now and discover the exclusive benefits awaiting you.
- Qlik Community
- :
- All Forums
- :
- QlikView App Dev
- :
- Normalizing Charts
- Subscribe to RSS Feed
- Mark Topic as New
- Mark Topic as Read
- Float this Topic for Current User
- Bookmark
- Subscribe
- Mute
- Printer Friendly Page
- Mark as New
- Bookmark
- Subscribe
- Mute
- Subscribe to RSS Feed
- Permalink
- Report Inappropriate Content
Normalizing Charts
Hi,
I have the ffg chart:
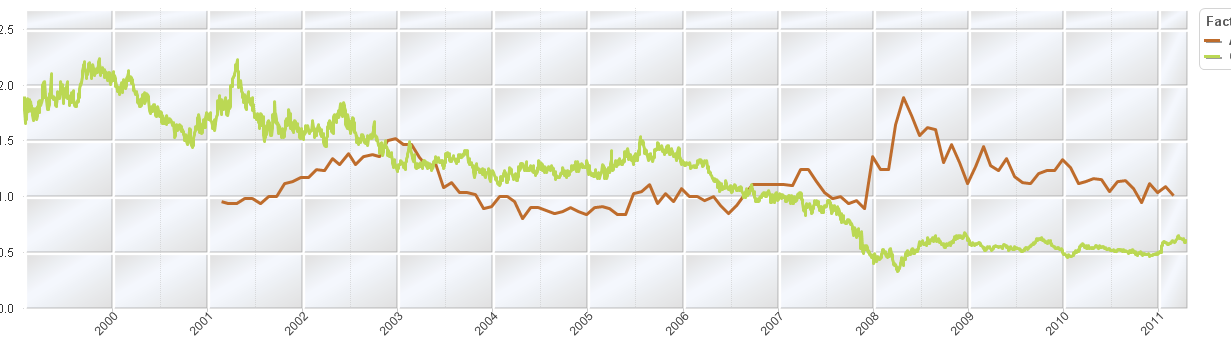
I am trying to normalize this graph between 0 and 1.
I just need to get the maximum and minimum for each line and then I can normalize it but I can't seem to get this because my expression,
is:
Value/Value1 which is actually equal to max(Value)/max(Value1), but I do not want this,
I want Value/Value1 and also get the MAX(Value) throughout the years. so I can eventually use an expression like the ffg:
(Value/MAX(Value))/(Value1/MAX(Value1)) --> results in 1 all the time which I do not want
PLEASE HELP, this is really important for me to implement.
Kind Regards
Razak
- Mark as New
- Bookmark
- Subscribe
- Mute
- Subscribe to RSS Feed
- Permalink
- Report Inappropriate Content
Hi,
Check this is what you are expecting
= (Value/MAX(TOTAL Value))/(Value1/MAX(TOTAL Value1))
Hope this helps you.
Regards,
Jagan.