Unlock a world of possibilities! Login now and discover the exclusive benefits awaiting you.
- Qlik Community
- :
- All Forums
- :
- QlikView App Dev
- :
- Re: Notes/references on chart
- Subscribe to RSS Feed
- Mark Topic as New
- Mark Topic as Read
- Float this Topic for Current User
- Bookmark
- Subscribe
- Mute
- Printer Friendly Page
- Mark as New
- Bookmark
- Subscribe
- Mute
- Subscribe to RSS Feed
- Permalink
- Report Inappropriate Content
Notes/references on chart
Hi.
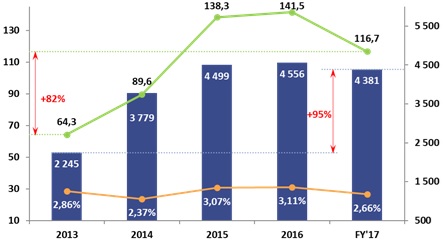
I want to show notes for some data on the graph. See red text in the picture. How can I do this most correctly in QlikView?
I can do it using macros with a trigger on "any selection" - move and resize transparent arrows over the chart. But this is very difficult and clears the cache.
Extension. Can I use a standard chart object and add some features to it? Or I have to create new object from the beginning?
Any other ideas?
Accepted Solutions
- Mark as New
- Bookmark
- Subscribe
- Mute
- Subscribe to RSS Feed
- Permalink
- Report Inappropriate Content
I could imagine that you could get quite near to your screenshot with a normal combo-chart (maybe not so nice looking but transferring the information) by adding two (or maybe more) additionally dimension-values which cover the first and the last rowno() of the chart.
This means the first dimension-value is dual('% dev. rate', 1), the second until the forelast is dual(Year, Year) and the last is dual('% dev. total', 100000) to be able to sort the chart appropriate and then querying the first/last value respectively rowno() and applying the %-calculation and to layout them specially (other colors, offset, ...).
- Marcus
- Mark as New
- Bookmark
- Subscribe
- Mute
- Subscribe to RSS Feed
- Permalink
- Report Inappropriate Content
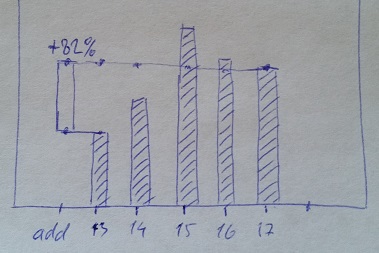
Do you mean something like this? Add a virtual value for dimension and draw a bar there with offset and label, and also add two expression to emitate reference lines?
- Mark as New
- Bookmark
- Subscribe
- Mute
- Subscribe to RSS Feed
- Permalink
- Report Inappropriate Content
Can you share some sample data/file to look into?
- Mark as New
- Bookmark
- Subscribe
- Mute
- Subscribe to RSS Feed
- Permalink
- Report Inappropriate Content
Sorry, not yet. The picture is a screenshot from PowerPoint.
- Mark as New
- Bookmark
- Subscribe
- Mute
- Subscribe to RSS Feed
- Permalink
- Report Inappropriate Content
Yes, this were my thoughts.