Unlock a world of possibilities! Login now and discover the exclusive benefits awaiting you.
- Qlik Community
- :
- All Forums
- :
- QlikView App Dev
- :
- OTD %
- Subscribe to RSS Feed
- Mark Topic as New
- Mark Topic as Read
- Float this Topic for Current User
- Bookmark
- Subscribe
- Mute
- Printer Friendly Page
- Mark as New
- Bookmark
- Subscribe
- Mute
- Subscribe to RSS Feed
- Permalink
- Report Inappropriate Content
OTD %
Hi,
Can someone help me to create a formula to represent %OTD?
I have:
OTD =PO SHIPMENT REQUEST DATE- PO SHIP DATE
+-3 days is LATE DELIVERY
I am looking for a column that shows : LATE or ON TIME
As well be able to add a chart.
Thank you very much for your help
- Mark as New
- Bookmark
- Subscribe
- Mute
- Subscribe to RSS Feed
- Permalink
- Report Inappropriate Content
Would you be able to share some raw data with the output you expect to see from it?
- Mark as New
- Bookmark
- Subscribe
- Mute
- Subscribe to RSS Feed
- Permalink
- Report Inappropriate Content
For %OTD you could use something like below?
Sum(OTD) / Count(OTD)
- Mark as New
- Bookmark
- Subscribe
- Mute
- Subscribe to RSS Feed
- Permalink
- Report Inappropriate Content
Something like this, perhaps?
Count(If([PO SHIP DATE] - [PO SHIPMENT REQUEST DATE] > 3, [PO NUMBER])) / Count([PO NUMBER])
(assumes that a shipment has an id like PO NUMBER. Replace this with the correct field name)
- Mark as New
- Bookmark
- Subscribe
- Mute
- Subscribe to RSS Feed
- Permalink
- Report Inappropriate Content
You can try some this ways
Load
If( (PO SHIPMENT REQUEST DATE- PO SHIP DATE ) > 3 ,'LATE','On TIME') as DeliveryStatus
From Source;
Or
Load
If( (Interval( PO SHIPMENT REQUEST DATE- PO SHIP DATE,' D hh:mm ' ) ) > 3 ,'LATE','On TIME') as DeliveryStatus
From Source;
- Mark as New
- Bookmark
- Subscribe
- Mute
- Subscribe to RSS Feed
- Permalink
- Report Inappropriate Content
I would suggest to create the Flag in script to make the expression more optmized
LOAD *,
if(PO SHIPMENT REQUEST DATE- PO SHIP DATE <=-3, 1,0) as isShipmentLate
FROM table;
Now you can put the expression like below chart
=count(distinct {<isShipmentLate={1}>} ID) / count( distinct ID)
You can remove the DISTINCT keyword from expression based on your data.
Here ID is the field which you want to count.
Or if you want the % based on Value, use below
=sum({<isShipmentLate={1}>} Value) / sum( Value)
- Mark as New
- Bookmark
- Subscribe
- Mute
- Subscribe to RSS Feed
- Permalink
- Report Inappropriate Content
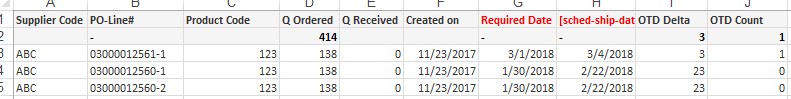
@stalwar1 Finally back...my apologies for my delay. Please see attached table that i was able to create with everyone's advises.
I want to add to the Gauge chart a graph showing the trend of the previous months.
Can you please help me?
I update the OTD =<7 days vs Required Date ( changed from 3 days)
thanks,