Unlock a world of possibilities! Login now and discover the exclusive benefits awaiting you.
- Qlik Community
- :
- All Forums
- :
- QlikView App Dev
- :
- On time delivery by order and by order lines
- Subscribe to RSS Feed
- Mark Topic as New
- Mark Topic as Read
- Float this Topic for Current User
- Bookmark
- Subscribe
- Mute
- Printer Friendly Page
- Mark as New
- Bookmark
- Subscribe
- Mute
- Subscribe to RSS Feed
- Permalink
- Report Inappropriate Content
On time delivery by order and by order lines
Dear All,
I need to build an application regarding on time delivery.
i have a test database with :
- [Date Facture], being Actual invoicing date
- [No Cde], being order number
- [Delai Demande], being customer requested date
- [Date Facture] - [Delai Demande] as [Delai client] being the difference between the actual Invoicing date and the customer requested date.
in the script i set up a variable to determine wther a customer is satisfied. If [Delai client] is less than 1 then the customer is satisfied.
LOAD *,
If([Delai client] <= 1, 'OUI', 'NON') as [Client satisfait];
So far so good.
First output i have to produce is the order lines delivered on times. For this one, i am ok.
Second output i have to produce is the global orders delivered on time. For this one i am struggling.
For instance, in my test database, i have a 22 lines order. 19 lines have been delivered on time. Then the indicator is 86 %
Meanwhile the order is not full delivered on time (three items have been delivered later), then the indicator this time should be 0 %
Qvw as well as excel database attached for those who could help.
Thanks in advance
Guillaume
Accepted Solutions
- Mark as New
- Bookmark
- Subscribe
- Mute
- Subscribe to RSS Feed
- Permalink
- Report Inappropriate Content
May be this:
=Count(DISTINCT {<[No Cde] = {"=Count({<[Client satisfait] = {'OUI'}>}[No Cde]) = Count([No Cde])"}>} [No Cde])/Count(DISTINCT [No Cde])
- Mark as New
- Bookmark
- Subscribe
- Mute
- Subscribe to RSS Feed
- Permalink
- Report Inappropriate Content
Meanwhile the order is not full delivered on time (three items have been delivered later), then the indicator this time should be 0 %
Order not full delivered on time should be 0%? How? Can you explain the logic here? Also, where exactly are you looking to show this 0%?
- Mark as New
- Bookmark
- Subscribe
- Mute
- Subscribe to RSS Feed
- Permalink
- Report Inappropriate Content
If all the lines of the order are delivered on time, the order is considered as delivered on time.
If only one line is not delivered on time, then the order is not considered delivered on time.
in my test database, there is only one order so the output should be 0 % of order delivered on time.
I need to show this 0 % in a gauge chart
- Mark as New
- Bookmark
- Subscribe
- Mute
- Subscribe to RSS Feed
- Permalink
- Report Inappropriate Content
May be this:
=Count(DISTINCT {<[No Cde] = {"=Count({<[Client satisfait] = {'OUI'}>}[No Cde]) = Count([No Cde])"}>} [No Cde])/Count(DISTINCT [No Cde])
- Mark as New
- Bookmark
- Subscribe
- Mute
- Subscribe to RSS Feed
- Permalink
- Report Inappropriate Content
Thanks a lot Sunny. This is perfect.
Just one last request :
i want to add to the gauge chart a graph showing the trend of the previous months. Knowing that the user will have the current month selected.
Which means as March 2016 in selection :
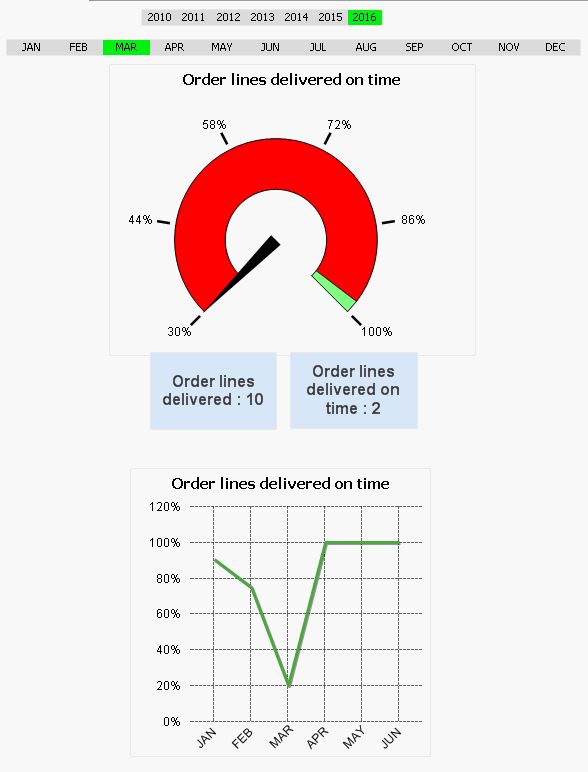
For the "order lines delivered on time" trend, i am using below formulas wich is working fine :
= (Count({<[Client satisfait] = {'OUI'},Mois= {JAN,FEB,MAR,APR,MAY,JUN,JUL,AUG,SEP,OCT,NOV,DEC}>} [Client satisfait]) / Count({<Mois= {JAN,FEB,MAR,APR,MAY,JUN,JUL,AUG,SEP,OCT,NOV,DEC}>} [Client satisfait])).
Meanwhile for the "complete order delivered on time" trend, below formulas is only showing the results for the selected month :
=Count(DISTINCT {<[No Cde] = {"=Count({<[Client satisfait] = {'OUI'}>}[No Cde]) = Count([No Cde])"},Mois= {JAN,FEB,MAR,APR,MAY,JUN,JUL,AUG,SEP,OCT,NOV,DEC}>} [No Cde]) /Count(DISTINCT{<Mois= {JAN,FEB,MAR,APR,MAY,JUN,JUL,AUG,SEP,OCT,NOV,DEC}>}[No Cde])
This is what i get :

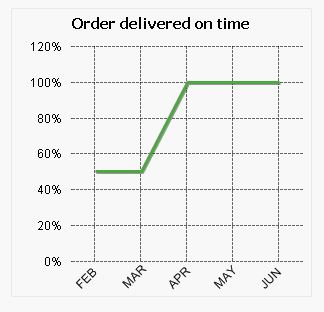
And this is what i should get :
I may miss something somewhere.
Txs in advance
Guillaume
- Mark as New
- Bookmark
- Subscribe
- Mute
- Subscribe to RSS Feed
- Permalink
- Report Inappropriate Content
Try this:
=Count(DISTINCT {<[No Cde] = {"=Count({<[Client satisfait] = {'OUI'}, Mois>}[No Cde]) = Count({<Mois>} [No Cde])"}, Mois>} [No Cde])
/
Count(DISTINCT{<Mois>}[No Cde])
- Mark as New
- Bookmark
- Subscribe
- Mute
- Subscribe to RSS Feed
- Permalink
- Report Inappropriate Content
Wonderful !