Unlock a world of possibilities! Login now and discover the exclusive benefits awaiting you.
- Qlik Community
- :
- All Forums
- :
- QlikView App Dev
- :
- One expression gives two answers in two different ...
- Subscribe to RSS Feed
- Mark Topic as New
- Mark Topic as Read
- Float this Topic for Current User
- Bookmark
- Subscribe
- Mute
- Printer Friendly Page
- Mark as New
- Bookmark
- Subscribe
- Mute
- Subscribe to RSS Feed
- Permalink
- Report Inappropriate Content
One expression gives two answers in two different charts
Hi,
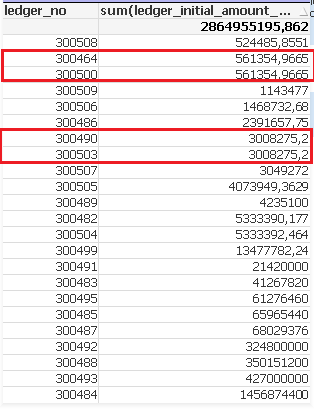
I have an Expression used in two different Charts. In the charts I have different Dimensions. The different Dimension is 'ledger_no'.
I have expected that the totals in the charts would be the same. The correct total result is in the chart that have ledger_no as column.
But in reality they shows a lot of deviations in total.
Someone explains why!
- Mark as New
- Bookmark
- Subscribe
- Mute
- Subscribe to RSS Feed
- Permalink
- Report Inappropriate Content
Hi,
It is the distinct keyword which is causing the problem.
Kindly remove the Distinct keyword and both the charts will show same total.
Regards,
Kaushik Solanki
- Mark as New
- Bookmark
- Subscribe
- Mute
- Subscribe to RSS Feed
- Permalink
- Report Inappropriate Content
four of your ledger_no has same ledger_initial_amount_bc value so when you are doing distinct in the expression these two duplicate values are getting ignored however when you add the ledger_no to the chart these duplicates are getting added.

- Mark as New
- Bookmark
- Subscribe
- Mute
- Subscribe to RSS Feed
- Permalink
- Report Inappropriate Content
Thanks. That helps!