Unlock a world of possibilities! Login now and discover the exclusive benefits awaiting you.
- Qlik Community
- :
- All Forums
- :
- QlikView App Dev
- :
- Order Pivot Chart
- Subscribe to RSS Feed
- Mark Topic as New
- Mark Topic as Read
- Float this Topic for Current User
- Bookmark
- Subscribe
- Mute
- Printer Friendly Page
- Mark as New
- Bookmark
- Subscribe
- Mute
- Subscribe to RSS Feed
- Permalink
- Report Inappropriate Content
Order Pivot Chart
Afternoon All
I am using QV 10, I am trying to create a strange pivot chart, currently it looks like this:
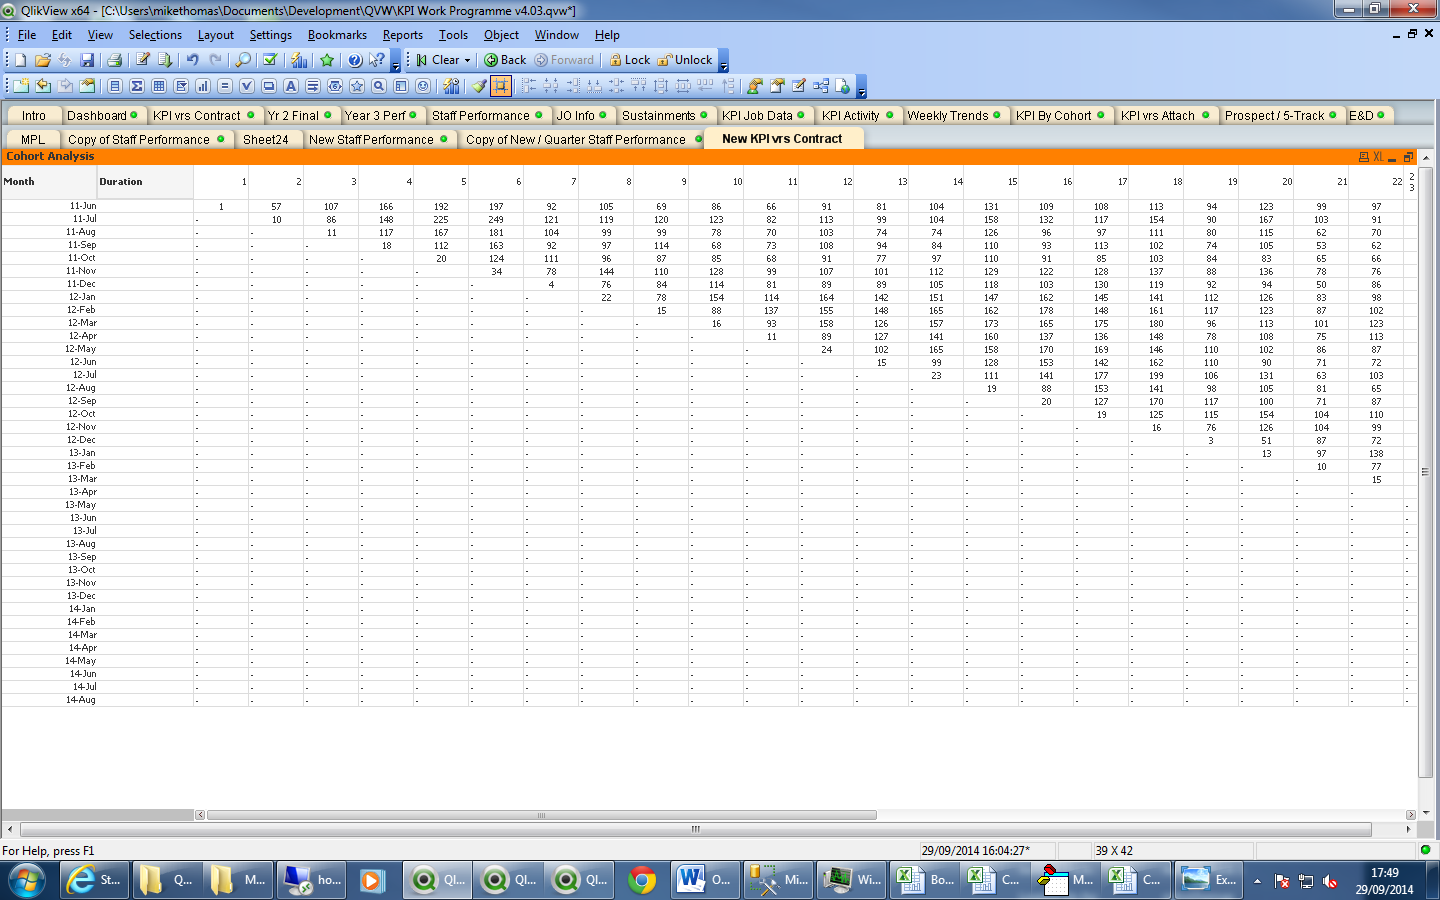
The duration is simply a number representation of the Month which is a calculated dimension. However what I would like is for the chart show in column 1 (Duration 1) the first value of each row, Duration 2 the second value etc. So the first 3 rows and columns should display:
| Month | 1 | 2 | 3 |
| 11-Jun | 1 | 57 | 107 |
| 11-Jul | 10 | 86 | 148 |
| 11-Aug | 11 | 117 | 167 |
Rather than:
| Month | 1 | 2 | 3 | 4 | 5 |
| 11-Jun | 1 | 57 | 107 | 166 | 192 |
| 11-Jul | - | 10 | 86 | 148 | 225 |
| 11-Aug | - | - | 11 | 117 | 167 |
Hopefully that makes sense! Either its difficult to explain or I have looked at this way to much and can no longer understand!!
Thanks for any guidance..
Cheers
Mike
- Mark as New
- Bookmark
- Subscribe
- Mute
- Subscribe to RSS Feed
- Permalink
- Report Inappropriate Content
Can you show sample input
- Mark as New
- Bookmark
- Subscribe
- Mute
- Subscribe to RSS Feed
- Permalink
- Report Inappropriate Content
Hello,
The data is part of a much larger table however this calculation is using 3 columns (didn't explain it that well first):
Product Month Date DebtID
01/10/2011 02/10/2011 ASF1234
01/10/2011 02/10/2011 ASE3124
01/10/2011 01/11/2011 ASD1234
01/10/2011 01/11/2011 ASD1641
01/10/2011 07/12/2011 ASC1687
01/11/2011 07/12/2011 ASC1688
01/11/2011 08/12/2011 ASC1689
01/11/2011 08/12/2011 ASC1690
01/11/2011 07/12/2011 ASC1691
etc
So should get
month 1 2 3
01/10/2011 2 2 1
01/11/2011 4
Currently I would get:
month 1 2 3 << Count of Debt ID
01/10/2011 2 2 1
01/11/2011 4
So basically the above chart shows 2 people went into debt on month 1 of the product released in oct 2010. It also shows that 4 people went into debt on the month 1 of the product released in nov 2011. But its showing as 3.
Does that help?
In reality the Duration should not be based on a date as the pivot chart is doing what it should do/
Cheers