Unlock a world of possibilities! Login now and discover the exclusive benefits awaiting you.
- Qlik Community
- :
- All Forums
- :
- QlikView App Dev
- :
- Re: PY Value as calcultated dimension
- Subscribe to RSS Feed
- Mark Topic as New
- Mark Topic as Read
- Float this Topic for Current User
- Bookmark
- Subscribe
- Mute
- Printer Friendly Page
- Mark as New
- Bookmark
- Subscribe
- Mute
- Subscribe to RSS Feed
- Permalink
- Report Inappropriate Content
PY Value as calcultated dimension
Hi,
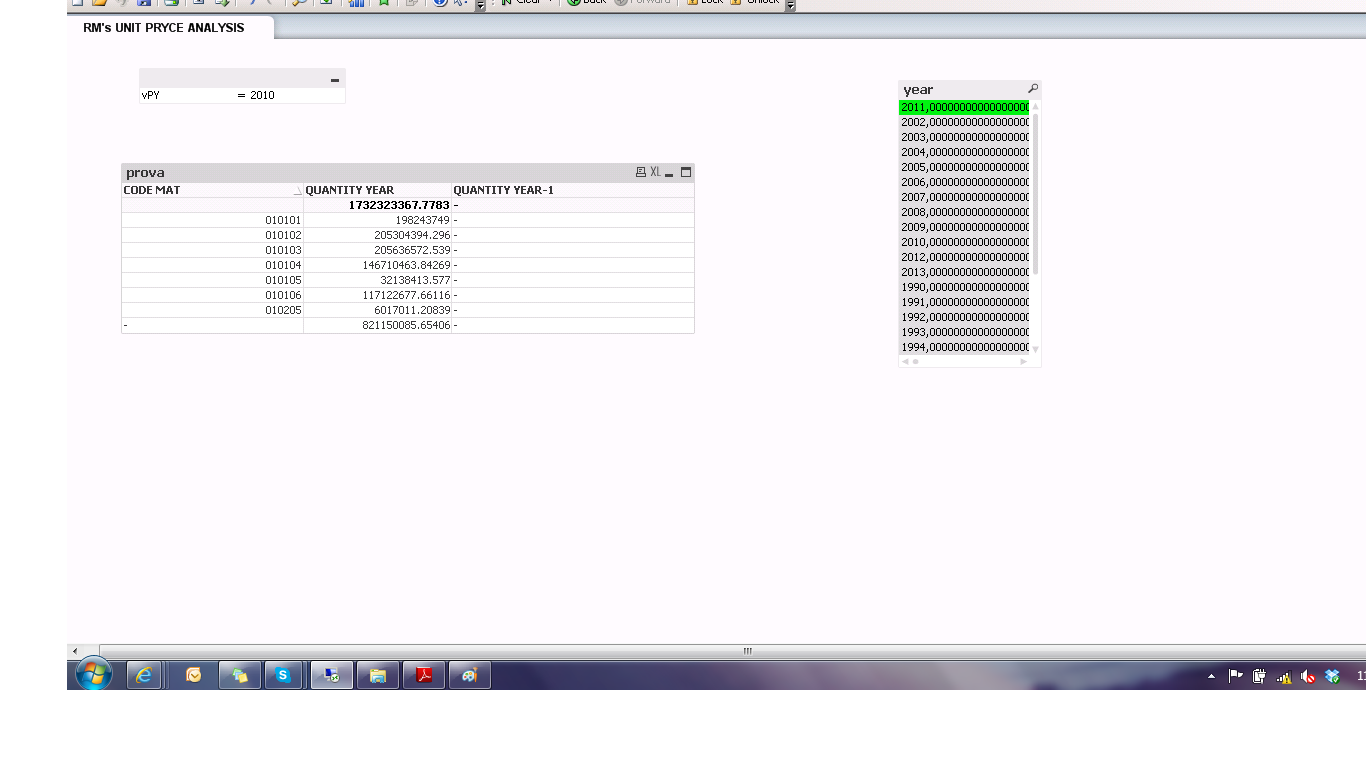
I have a pivot table with detail for Code Mat on vertical and Month on horizontal (see the attachment). The user is forced to select at least one value for the Year, Country and Currency.
I need to calculate the Quantity for the previous year based on the user selection: If he selects 2013 he'll visualize the Quantity for 2012 and so on. This indicator will be a calculated dimension. I can't get the correct formula.
I tried to create it but it seems like it gets the total quantity for all the years and when I change the year the value doesn't change:
=num(aggr(Sum({<YEAR= {"$(=Max(YEAR)-1)"},YEAR=>} QUANTITY) , CODE_MAT), '#,##0.##', '.' , ',' )
Can you help me with this, please?
- « Previous Replies
-
- 1
- 2
- Next Replies »
- Mark as New
- Bookmark
- Subscribe
- Mute
- Subscribe to RSS Feed
- Permalink
- Report Inappropriate Content
I've created a new document containing a straight table, just like in the attachment. I've noticed the Year is read by QV as a string although in our data base is a number. So, I've tried something more simplified in order to get the value (then I'll do it in the pivot table as well):
=Sum({<NUM(YEAR, '###0')= {$(vPY)}>} QUANTITY)
where
vPY = max(Year)-1
Is there something wrong with my expression? Still doesn't work! I can't see any value in my column 
thank you
- Mark as New
- Bookmark
- Subscribe
- Mute
- Subscribe to RSS Feed
- Permalink
- Report Inappropriate Content
Finally, problem solved! I formatted the Year into the script: num(Year, '###0') and now everything is going well.

- « Previous Replies
-
- 1
- 2
- Next Replies »