Unlock a world of possibilities! Login now and discover the exclusive benefits awaiting you.
- Qlik Community
- :
- All Forums
- :
- QlikView App Dev
- :
- Percent Change - Large Volume Data-set, Multiple M...
- Subscribe to RSS Feed
- Mark Topic as New
- Mark Topic as Read
- Float this Topic for Current User
- Bookmark
- Subscribe
- Mute
- Printer Friendly Page
- Mark as New
- Bookmark
- Subscribe
- Mute
- Subscribe to RSS Feed
- Permalink
- Report Inappropriate Content
Percent Change - Large Volume Data-set, Multiple Measures
We have a need to calculate change, percent change on multiple measures in a single table. Sort of Income Statement comparing one year to another.
The data looks something like this:
| Year | Customer | Region | Material Cost | Labor | Shipping | Revenue |
| 2008 | A | WEST | 10 | 10 | 10 | 10 |
| 2008 | B | EAST | 20 | 20 | 20 | 20 |
| 2008 | C | NW | 30 | 30 | 30 | 30 |
| 2008 | D | SW | 50 | 50 | 50 | 50 |
| 2008 | E | EW | 60 | 60 | 60 | 60 |
| 2008 | F | NORTH | 70 | 70 | 70 | 70 |
| 2009 | A | WEST | 100 | 1 | 5 | 10 |
| 2009 | B | EAST | 200 | 2 | 10 | 20 |
| 2009 | C | NW | 300 | 3 | 15 | 30 |
| 2009 | D | SW | 400 | 4 | 20 | 50 |
| 2009 | E | EW | 500 | 5 | 30 | 60 |
| 2009 | F | NORTH | 600 | 6 | 35 | 70 |
| 2010 | A | NORTH | 10 | 5 | 1 | 100 |
| 2010 | A | SOUTH | 20 | 10 | 2 | 200 |
| 2010 | B | NORTH | 30 | 15 | 3 | 300 |
| 2010 | B | NW | 50 | 20 | 4 | 400 |
| 2010 | E | SW | 60 | 30 | 5 | 500 |
| 2010 | F | NW | 70 | 35 | 6 | 600 |
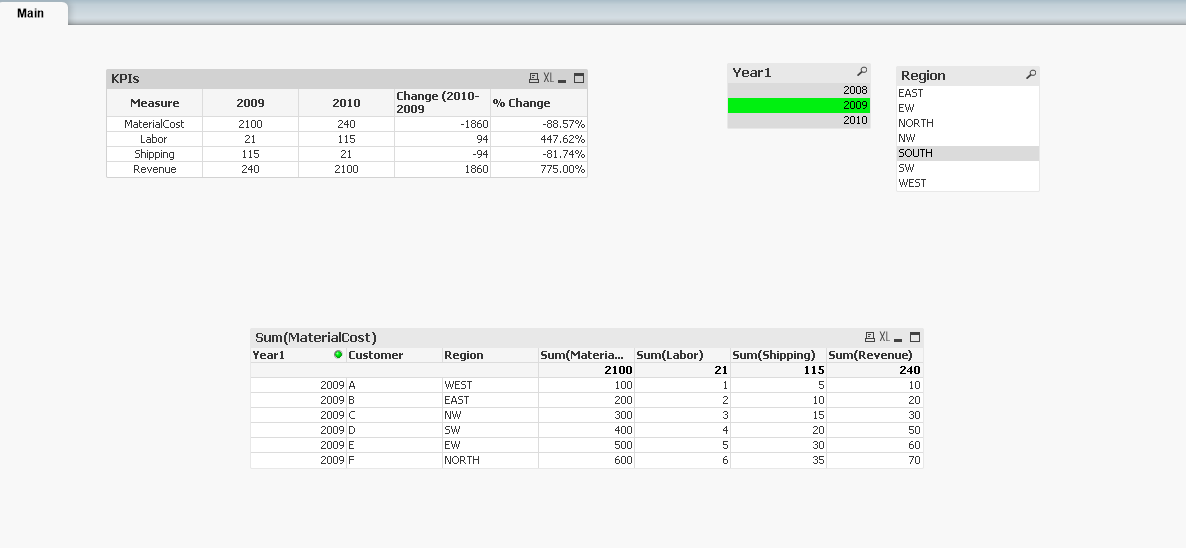
The desired result is:
| Measure | 2009 | 2010 | Change (2010 - 2009) | % Change |
| Material Cost | 2100 | 240 | -1860 | -88.57% |
| Labor | 21 | 115 | 94 | 447.62% |
| Shipping | 115 | 21 | -94 | -81.74% |
| Revenue | 310 | 2100 | 1790 | 577.42% |
The output needs to be a single table. Please remember the volume is approx 500 millions rows and there are multiple views. Need solution:
1. That will not be a performance hog.
2. Can be filtered on Year, Customer Region
3. If user selects 2010 then 2009 is auto selected if 2009 is selected then 2008 is auto selected.
4. Set Analysis and Multiple tables are causing performance issues
Please offer expert opinion. !
- Mark as New
- Bookmark
- Subscribe
- Mute
- Subscribe to RSS Feed
- Permalink
- Report Inappropriate Content
I think you will need to try various datamodel approaches to find the for you suitable solution which will be depend where is your most difficult bottleneck.
The first thing which I would try is to transform your crosstable to a "normal" data-table which will return a table like:
Year Customer Region Categorie Value
and would then simply use a pivot with Categorie as vertical dimension and for each column an own expression like:
sum({< Year = {"$(=max(Year)-1)"}>} Value)
sum({< Year = {"$(=max(Year))"}>} Value)
column(2) - column(1)
column(2) / column(1) - 1
If the application (transformed table will be probably bigger as the crosstable) or the pivot is too slow you could try other approaches including another user-behaviour and/or upgrading the hardware-ressources then I don't believe that are much percentage of performance-optimizing against my suggestion to your requirements.
- Marcus
- Mark as New
- Bookmark
- Subscribe
- Mute
- Subscribe to RSS Feed
- Permalink
- Report Inappropriate Content
@marcussommer ... interesting.
You are suggesting a move from dimensional data model. Performing this on 500 million rows of data will be a challenge. Ironically this app is migrating from Oracle Enterprise Business Intelligence Suite (OB). In OB there are functions which will let you do the calculations on the fly. Surprisingly QlikView will not.
Do you happen to know how to get QlikTech involved in this for a solution.
- Mark as New
- Bookmark
- Subscribe
- Mute
- Subscribe to RSS Feed
- Permalink
- Report Inappropriate Content
From a qlikview datamodel point of view is the transform from a crosstable to a normal table quite common and results often in a good gui-performance. The transform itself will be need some time but if you used incremental load approaches combined with optimized loadings - see: Advanced topics for creating a qlik datamodel - it will be fast in the daily business.
500 M rows aren't small but it's not so big to worry much about it - I think with a current middle-sized server should it already work. I suggest you takes some attempts before you asked your partner or the qlik support for technical assistance.
Another way might be to change your oracle-output.
- Marcus
- Mark as New
- Bookmark
- Subscribe
- Mute
- Subscribe to RSS Feed
- Permalink
- Report Inappropriate Content
Hi,
Just for my learning I tried to replicate the requirement in qlik using sample data, it may be utilized as prototype in initial phase. Please see attached qvw file. The table at the end is just a working table.
- Mark as New
- Bookmark
- Subscribe
- Mute
- Subscribe to RSS Feed
- Permalink
- Report Inappropriate Content
@digvijaysingh and @marcussommer
@I though about using Pick + Match. What's your take on performance??
Thanks.
- Mark as New
- Bookmark
- Subscribe
- Mute
- Subscribe to RSS Feed
- Permalink
- Report Inappropriate Content
@marcussommer
Could you point me to a scriplet that will allow to do this transformation i.e. from Cross Table to Straight Table? I am inclined to try it.
Thanks.
- Mark as New
- Bookmark
- Subscribe
- Mute
- Subscribe to RSS Feed
- Permalink
- Report Inappropriate Content
It should look like:
table:
crosstable(Categorie, Value, 3)
Load * From YourTable;
A good explanation is here: The Crosstable Load.
- Marcus
- Mark as New
- Bookmark
- Subscribe
- Mute
- Subscribe to RSS Feed
- Permalink
- Report Inappropriate Content
Pick(Match()) is quite fast compared with if-loops but compared with flags like sum(Value * Flag) it's slow. But for what want you this use in this case?
- Marcus
- Mark as New
- Bookmark
- Subscribe
- Mute
- Subscribe to RSS Feed
- Permalink
- Report Inappropriate Content
If we enforce filtering, it may only need to deal with subset of data at a time. We know how good QV is in fetching data based on associations. I am not sure how much impact on qvw size will have if we load data differently as suggested by Marcus.