Unlock a world of possibilities! Login now and discover the exclusive benefits awaiting you.
- Qlik Community
- :
- All Forums
- :
- QlikView App Dev
- :
- Percentage Graph
- Subscribe to RSS Feed
- Mark Topic as New
- Mark Topic as Read
- Float this Topic for Current User
- Bookmark
- Subscribe
- Mute
- Printer Friendly Page
- Mark as New
- Bookmark
- Subscribe
- Mute
- Subscribe to RSS Feed
- Permalink
- Report Inappropriate Content
Percentage Graph
Hello All,
I have a input object and reference line. I will be given a percentage in input box and the reference line will show according ly in graph.
For example, if I give 80 % in the input box I need to display the dimension value which is having 80 % together.
For example I have to display Delhi, Chennai,Bangalore in my KPI box.

Please help
Accepted Solutions
- Mark as New
- Bookmark
- Subscribe
- Mute
- Subscribe to RSS Feed
- Permalink
- Report Inappropriate Content
Hello,
I am not 100% sure that I have understood the exact use case scenario, however I have some options for you that might help you resolve the issue or at least help you get on the right path towards the solution.
These are my understandings so far:
- You have mentioned "which is having 80 % together", and then you have specified that the response is "Delhi, Chennai, Bangalore". Therefore, my assumption is that you would like to display the values of the Dimension where the Accc Percentage value is less or equal to the specified value in the Input Box object.
- You have specified "KPI box" so I assume that you also want to have the count of the calculated Dimension values, where in the example provided is 3.
- Finally, you have specified "reference line", however I am not 100% sure where exactly you want to display it.
Hopefully the information below will be enough to get you started on the right path towards the resolution:
1. We have the following dataset:

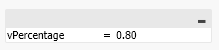
2. We have created an Input Box with variable:
3. Now you can create 2 Text Objects to construct custom KPI and you can use the following expressions:
- =Concat( {<[Accc Percentage]={"<=$(vPercentage)"}>} Dimension, ', ')
- =Count( {<[Accc Percentage]={"<=$(vPercentage)"}>} Dimension)
First expression gets all the Dimensions where the percentage is equal and less than the specified value in the variable given through the Input Box, while at the same time it concatenates all the values with an ', ' in-between. The second expressions counts all the Dimensions where the percentage is equal or less than the specified value in the variable within the Input Box. The output is:
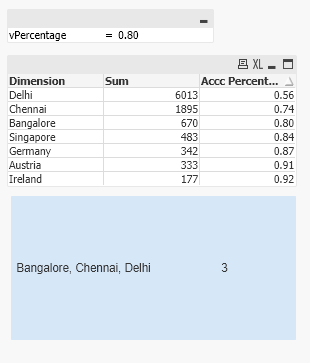
As you can see the output is the 3 Dimension values that you have specified in the example and the count value as KPI is 3.
I hope that this information was helpful. In case I have misunderstood the use case scenario, please elaborate in details by providing additional information. However, if it has helped you resolve the issue, please mark it as accepted solution to give further visibility to other community members.
- Mark as New
- Bookmark
- Subscribe
- Mute
- Subscribe to RSS Feed
- Permalink
- Report Inappropriate Content
Hello @Prabhu1204,
This might not be possible in the specific use case scenario. The reason for that is because for the use case scenario above, we are using Set Analysis to get the data that we need. According to "Set analysis and set expressions > Modifiers" [1], it is stated that " A modifier consists of one or several field names, each followed by one or several selections that can be made in the field", which means that modifiers support only already existing fields in the dataset.
In the example shared above, with the expression =Count( {<[Accc Percentage]={"<=$(vPercentage)"}>} Dimension) we are comparing the percentage value with the already found [Accc Percentage] field in the dataset, however you need to do =Count( {<RangeSum(Above(Sum(["Spend"], 0, RowNo())) / Sum( total ["Spend"])={"<=$(vPercentage)"}>} Dimension) which is not possible. Even if you try to do simple calculation instead of using a field, such as =Count( {<Avg(Sum)={"<=$(vPercentage)"}>} Dimension) you will get an error and it will fail.
The solution in this case will be to load the data through the Data load editor and create the percentage values that you need in a new field. This will ensure that when you are going to do the analysis of the data, you will be able to use the expressions shared in my previous answer. Additionally, this will ensure that you only calculate the percentages once (when the data is loaded) and you calculate the percentages again, only during reload, which improves the performance of your app. Because having the percentages being calculated within the sheet, it means that every time there is an update the expression is evaluated again, which consequently consumes constantly your resources.
I hope that this information was helpful!
---
- Mark as New
- Bookmark
- Subscribe
- Mute
- Subscribe to RSS Feed
- Permalink
- Report Inappropriate Content
Hello,
I am not 100% sure that I have understood the exact use case scenario, however I have some options for you that might help you resolve the issue or at least help you get on the right path towards the solution.
These are my understandings so far:
- You have mentioned "which is having 80 % together", and then you have specified that the response is "Delhi, Chennai, Bangalore". Therefore, my assumption is that you would like to display the values of the Dimension where the Accc Percentage value is less or equal to the specified value in the Input Box object.
- You have specified "KPI box" so I assume that you also want to have the count of the calculated Dimension values, where in the example provided is 3.
- Finally, you have specified "reference line", however I am not 100% sure where exactly you want to display it.
Hopefully the information below will be enough to get you started on the right path towards the resolution:
1. We have the following dataset:
2. We have created an Input Box with variable:
3. Now you can create 2 Text Objects to construct custom KPI and you can use the following expressions:
- =Concat( {<[Accc Percentage]={"<=$(vPercentage)"}>} Dimension, ', ')
- =Count( {<[Accc Percentage]={"<=$(vPercentage)"}>} Dimension)
First expression gets all the Dimensions where the percentage is equal and less than the specified value in the variable given through the Input Box, while at the same time it concatenates all the values with an ', ' in-between. The second expressions counts all the Dimensions where the percentage is equal or less than the specified value in the variable within the Input Box. The output is:
As you can see the output is the 3 Dimension values that you have specified in the example and the count value as KPI is 3.
I hope that this information was helpful. In case I have misunderstood the use case scenario, please elaborate in details by providing additional information. However, if it has helped you resolve the issue, please mark it as accepted solution to give further visibility to other community members.
- Mark as New
- Bookmark
- Subscribe
- Mute
- Subscribe to RSS Feed
- Permalink
- Report Inappropriate Content
Thanks, it helps a lot. For find the percentage I am using Rangesum like below
RangeSum(Above(Sum(["Spend"], 0, RowNo()))
/ Sum( total ["Spend"]) in the graph
So, how to use the above expression in set expression.
- Mark as New
- Bookmark
- Subscribe
- Mute
- Subscribe to RSS Feed
- Permalink
- Report Inappropriate Content
Hello @Prabhu1204,
This might not be possible in the specific use case scenario. The reason for that is because for the use case scenario above, we are using Set Analysis to get the data that we need. According to "Set analysis and set expressions > Modifiers" [1], it is stated that " A modifier consists of one or several field names, each followed by one or several selections that can be made in the field", which means that modifiers support only already existing fields in the dataset.
In the example shared above, with the expression =Count( {<[Accc Percentage]={"<=$(vPercentage)"}>} Dimension) we are comparing the percentage value with the already found [Accc Percentage] field in the dataset, however you need to do =Count( {<RangeSum(Above(Sum(["Spend"], 0, RowNo())) / Sum( total ["Spend"])={"<=$(vPercentage)"}>} Dimension) which is not possible. Even if you try to do simple calculation instead of using a field, such as =Count( {<Avg(Sum)={"<=$(vPercentage)"}>} Dimension) you will get an error and it will fail.
The solution in this case will be to load the data through the Data load editor and create the percentage values that you need in a new field. This will ensure that when you are going to do the analysis of the data, you will be able to use the expressions shared in my previous answer. Additionally, this will ensure that you only calculate the percentages once (when the data is loaded) and you calculate the percentages again, only during reload, which improves the performance of your app. Because having the percentages being calculated within the sheet, it means that every time there is an update the expression is evaluated again, which consequently consumes constantly your resources.
I hope that this information was helpful!
---
- Mark as New
- Bookmark
- Subscribe
- Mute
- Subscribe to RSS Feed
- Permalink
- Report Inappropriate Content
@LiteBlue wrote:
Hello @Prabhu1204,
This might not be possible in the specific use case scenario. The reason for that is because for the use case scenario above, we are using Set Analysis to get the data that we need. According to "Set analysis and set expressions > Modifiers" [1], it is stated that " A modifier consists of one or several field names, each followed by one or several selections that can be made in the field", which means that modifiers support only already existing fields in the dataset.
In the example shared above, with the expression =Count( {<[Accc Percentage]={"<=$(vPercentage)"}>} Dimension) we are comparing the percentage value with the already found [Accc Percentage] field in the dataset, however you need to do =Count( {<RangeSum(Above(Sum(["Spend"], 0, RowNo())) / Sum( total ["Spend"])={"<=$(vPercentage)"}>} Dimension) which is not possible. Even if you try to do simple calculation instead of using a field, such as =Count( {<Avg(Sum)={"<=$(vPercentage)"}>} Dimension) you will get an error and it will fail.
The solution in this case will be to load the data through the Data load editor and create the percentage values that you need in a new field. This will ensure that when you are going to do the analysis of the data, you will be able to use the expressions shared in my previous answer. Additionally, this will ensure that you only calculate the percentages once (when the data is loaded) and you calculate the percentages again, only during reload, which improves the performance of your app. Because having the percentages being calculated within the sheet, it means that every time there is an update the expression is evaluated again, which consequently consumes constantly your resources.
I hope that this information was helpful!
---
Thank you for the reply, My Query has been solved.