Unlock a world of possibilities! Login now and discover the exclusive benefits awaiting you.
- Qlik Community
- :
- All Forums
- :
- QlikView App Dev
- :
- Pie Chart Data value points
- Subscribe to RSS Feed
- Mark Topic as New
- Mark Topic as Read
- Float this Topic for Current User
- Bookmark
- Subscribe
- Mute
- Printer Friendly Page
- Mark as New
- Bookmark
- Subscribe
- Mute
- Subscribe to RSS Feed
- Permalink
- Report Inappropriate Content
Pie Chart Data value points
Hi guys,
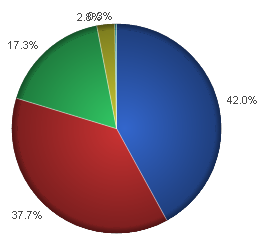
Values of my Pie chart are overlapping. Is there any way where I can insert values in the segments or can we make the numbers vertical.
I know this option "show numbers in legend" but i dnt want to use it.
let me know if we have any option.
thanks in advance
Bandari
- Mark as New
- Bookmark
- Subscribe
- Mute
- Subscribe to RSS Feed
- Permalink
- Report Inappropriate Content
Try below option, you might like it:
change your expression like below: i used Country as Dimension and Sales as Mear, chang them with your fields.
Dual(Country & '-' & Num(sum(Sales), '#,##0') & Repeat(chr(13)&chr(10), rank(Sum(Sales))-6),sum(Sales))
Select the Values on Data Points option. for expression
On the Sort tab, select the Y-Value option. Confirm Descending as the direction.
On the Presentation tab, deselect the Show Legend option.
hope it helps
- Mark as New
- Bookmark
- Subscribe
- Mute
- Subscribe to RSS Feed
- Permalink
- Report Inappropriate Content
Hi,
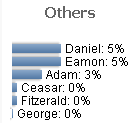
I would suggest hiding the small segments into segment Others (Dimension Limits tab), then if user wants to know their share, he can click on the Others to filtr them only.
I 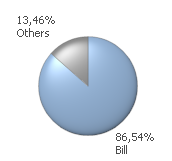
Or can you choose a bar chart, which provides basically the same information

Or you can use combination of them. In this case the bar chart will be set to show only those who are included in the Others segment and if the segment is not exist than the bar chart will be disabled. You should play with formatting more 🙂

Long story short I do not know any way not to overlap the data points labels and i offer some workaround.
Regards,
Jan