Unlock a world of possibilities! Login now and discover the exclusive benefits awaiting you.
- Qlik Community
- :
- All Forums
- :
- QlikView App Dev
- :
- Pie chart (range of values)
Options
- Subscribe to RSS Feed
- Mark Topic as New
- Mark Topic as Read
- Float this Topic for Current User
- Bookmark
- Subscribe
- Mute
- Printer Friendly Page
Turn on suggestions
Auto-suggest helps you quickly narrow down your search results by suggesting possible matches as you type.
Showing results for
Not applicable
2014-01-31
05:02 AM
- Mark as New
- Bookmark
- Subscribe
- Mute
- Subscribe to RSS Feed
- Permalink
- Report Inappropriate Content
Pie chart (range of values)
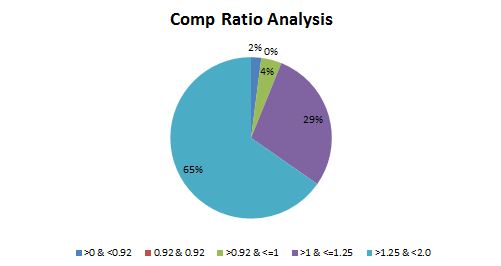
Can any one help, how to prepare this chart
Thanks in advance,
Pavan.
2,595 Views
- « Previous Replies
-
- 1
- 2
- Next Replies »
12 Replies
Not applicable
2014-01-31
06:37 AM
Author
- Mark as New
- Bookmark
- Subscribe
- Mute
- Subscribe to RSS Feed
- Permalink
- Report Inappropriate Content
Or whit a line chart with Squares Symbol on Expression and whit a like 'Aged (Years)' and with a text in Chart(presentation tab) like ='Age (Years)'
245 Views
Not applicable
2014-01-31
07:19 AM
Author
- Mark as New
- Bookmark
- Subscribe
- Mute
- Subscribe to RSS Feed
- Permalink
- Report Inappropriate Content
HI,
As u said, I have take a line chart, with square as symbols.
But I didn't get the straight black thin line on the chart how to make that ?
If u have any idea, please let me know.
Thanks & Regards,
Pavan.
245 Views
Not applicable
2014-01-31
08:50 AM
Author
- Mark as New
- Bookmark
- Subscribe
- Mute
- Subscribe to RSS Feed
- Permalink
- Report Inappropriate Content
try to enable two 'Show Grid' flags in Axes tab of chart...
245 Views
- « Previous Replies
-
- 1
- 2
- Next Replies »