Unlock a world of possibilities! Login now and discover the exclusive benefits awaiting you.
- Qlik Community
- :
- All Forums
- :
- QlikView App Dev
- :
- Pie chart to show one value with value from 0 to 1...
- Subscribe to RSS Feed
- Mark Topic as New
- Mark Topic as Read
- Float this Topic for Current User
- Bookmark
- Subscribe
- Mute
- Printer Friendly Page
- Mark as New
- Bookmark
- Subscribe
- Mute
- Subscribe to RSS Feed
- Permalink
- Report Inappropriate Content
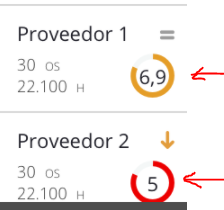
Pie chart to show one value with value from 0 to 10
Hi everyone,
I have to create a pie chart to show just one value out of 10:
What do I do to display it that way?
This is my data:
Provider, Mark
Proveedor1, 6.9
Proveedor2, 5
Thanks a lot in advance!
- Tags:
- pie chart
Accepted Solutions
- Mark as New
- Bookmark
- Subscribe
- Mute
- Subscribe to RSS Feed
- Permalink
- Report Inappropriate Content
Yes, they are gauge charts indeed. Please check this blog post out for more examples Dislike gauge charts? You may want to give them a second chance
- Mark as New
- Bookmark
- Subscribe
- Mute
- Subscribe to RSS Feed
- Permalink
- Report Inappropriate Content
Most likely that's one gauge chart with only one segment and some tweaks on the Presentation tab (i.e: thickness)
I'm sure the great amz can help you with that.
- Mark as New
- Bookmark
- Subscribe
- Mute
- Subscribe to RSS Feed
- Permalink
- Report Inappropriate Content
Use a gauge object for this:

Each one in this snip using a static gauge for the grey background overlaid with a normal gauge.Add the value using "Text in Chart" in Properties | Presentation or overlay a text object.
- Mark as New
- Bookmark
- Subscribe
- Mute
- Subscribe to RSS Feed
- Permalink
- Report Inappropriate Content
Yes, they are gauge charts indeed. Please check this blog post out for more examples Dislike gauge charts? You may want to give them a second chance
- Mark as New
- Bookmark
- Subscribe
- Mute
- Subscribe to RSS Feed
- Permalink
- Report Inappropriate Content
Thanks a lot guys, all answers were helpful, I got it.