Unlock a world of possibilities! Login now and discover the exclusive benefits awaiting you.
- Qlik Community
- :
- All Forums
- :
- QlikView App Dev
- :
- Pill Chart
- Subscribe to RSS Feed
- Mark Topic as New
- Mark Topic as Read
- Float this Topic for Current User
- Bookmark
- Subscribe
- Mute
- Printer Friendly Page
- Mark as New
- Bookmark
- Subscribe
- Mute
- Subscribe to RSS Feed
- Permalink
- Report Inappropriate Content
Pill Chart
Hello -
I am using a pill chart to show capacity for tickets sold. For example, I have one section that holds 8,061 tickets. When I make a selection for a particular game, the pill changes to reflect the number of tickets sold in that section, however, the value is not displayed on the pill, unless you hover over the pill. I am more interested in having the number shown for reporting purposes (i.e. print a report and the number shows as opposed to just the pill filled in to where the tickets are sold)
Is this something that is possible to change in the chart properties or a setting for printing within the report?
Thank you.
Accepted Solutions
- Mark as New
- Bookmark
- Subscribe
- Mute
- Subscribe to RSS Feed
- Permalink
- Report Inappropriate Content
Go to your presentation tab and add Text in Chart. Use the same expression in here wrapped with the Num() function so you can format the value.
- Mark as New
- Bookmark
- Subscribe
- Mute
- Subscribe to RSS Feed
- Permalink
- Report Inappropriate Content
Hello Evan,
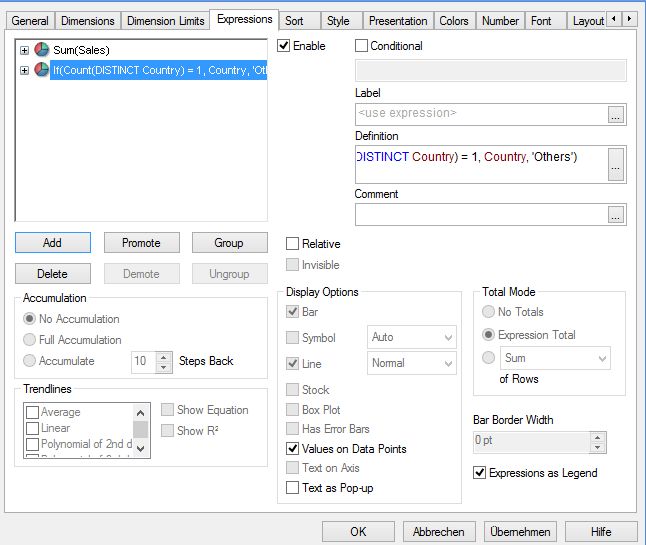
Try to check the tab called Value on data point you can find this in chart properties, Expression tab. and try this
- Mark as New
- Bookmark
- Subscribe
- Mute
- Subscribe to RSS Feed
- Permalink
- Report Inappropriate Content
Hello –
Thank you for the response. I am not using a pie chart, but a gauge chart (for which one of the options is a vertical pill)
The values on data point is not an option for that chart.
Any other suggestions?
- Mark as New
- Bookmark
- Subscribe
- Mute
- Subscribe to RSS Feed
- Permalink
- Report Inappropriate Content
Go to your presentation tab and add Text in Chart. Use the same expression in here wrapped with the Num() function so you can format the value.