Unlock a world of possibilities! Login now and discover the exclusive benefits awaiting you.
- Qlik Community
- :
- All Forums
- :
- QlikView App Dev
- :
- Pivot - Create "Calculated Item" like in MS Excel?
- Subscribe to RSS Feed
- Mark Topic as New
- Mark Topic as Read
- Float this Topic for Current User
- Bookmark
- Subscribe
- Mute
- Printer Friendly Page
- Mark as New
- Bookmark
- Subscribe
- Mute
- Subscribe to RSS Feed
- Permalink
- Report Inappropriate Content
Pivot - Create "Calculated Item" like in MS Excel?
Hello Everyone!
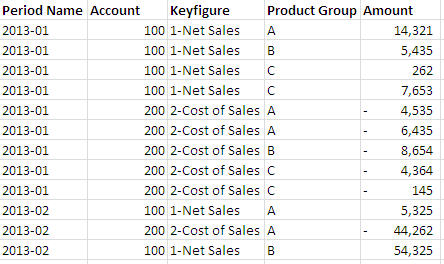
I'm new at Qlikview and have a problem with working with my data. The raw data (from a database) exists in a form like this:

Values are only in column "Amount".
Now I created a Pivot-Table in Qlikview. I'm showing Net Sales and Cost of Sales in different month. My problem now is that I need to calculate a field "Gross Profit" (=Net Sales - Cost of Sales). Showing the "Total" is not enough, because I have to create different charts including "Gross Profit" (like comparing Net Sales and Gross Profit).
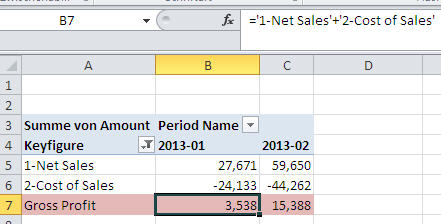
In MS Excel I'm able to create a "Calculated Item" within a field, like here:

Is there anything similar in Qlikview? I tried a lot of expressions, but the "best" I got was a new column with repeated values of Net Sales and Cost of Sales:

I think what I need is a new line/row within the field "Keyfigure". But I don't know if it's possible as all my values are in the raw data are in one column.
Thank you very, very much for your help!
Sandra
- Tags:
- new_to_qlikview
Accepted Solutions
- Mark as New
- Bookmark
- Subscribe
- Mute
- Subscribe to RSS Feed
- Permalink
- Report Inappropriate Content
Hello Sandra,
Yes, it is possible with set analysis.
Build a pivot table with month as dimension and then for expression use:
=sum({<Keyfigure={"1-Net Sales"}>}Amount) - label it 'Net Sales'
=sum({<Keyfigure={"2-Cost of Sales"}>}Amount) - label it 'Cost of Sales'
= [Net Sales]+[Cost of Sales] for Gross Profit
Best regards,
David
- Mark as New
- Bookmark
- Subscribe
- Mute
- Subscribe to RSS Feed
- Permalink
- Report Inappropriate Content
I couldn't understand ur problem sandra..
Simple "Sum(Amount)" will give same result? I think you created 2 expression.. single expression enough right?
Karthik
- Mark as New
- Bookmark
- Subscribe
- Mute
- Subscribe to RSS Feed
- Permalink
- Report Inappropriate Content
Tick on "Show Partial Sum" will help you to make total.. that is available in "Presentation" tab
find attachment..
Is this what you looking?
Karthi
- Mark as New
- Bookmark
- Subscribe
- Mute
- Subscribe to RSS Feed
- Permalink
- Report Inappropriate Content
Hello Sandra,
Yes, it is possible with set analysis.
Build a pivot table with month as dimension and then for expression use:
=sum({<Keyfigure={"1-Net Sales"}>}Amount) - label it 'Net Sales'
=sum({<Keyfigure={"2-Cost of Sales"}>}Amount) - label it 'Cost of Sales'
= [Net Sales]+[Cost of Sales] for Gross Profit
Best regards,
David
- Mark as New
- Bookmark
- Subscribe
- Mute
- Subscribe to RSS Feed
- Permalink
- Report Inappropriate Content
Hi
Dimension:
MonthYear
Expression:
=sum({<Keyfigure={"1-Net Sales"}>}Amount) - 'Net Sales'
=sum({<Keyfigure={"2-Cost of Sales"}>}Amount) - 'Cost of Sales'
= [Net Sales]+[Cost of Sales] for Gross Profit
And then drag and drop by using pivot table.
Please close the thread by marking correct answer & give likes if you like the post.
- Mark as New
- Bookmark
- Subscribe
- Mute
- Subscribe to RSS Feed
- Permalink
- Report Inappropriate Content
Thank you very much! That solves my problem. ![]()
Now I have to show [Cost of Sales] in the table, but that's okay for the moment. In a graph I'm able hide it.
Best regards,
Sandra
- Mark as New
- Bookmark
- Subscribe
- Mute
- Subscribe to RSS Feed
- Permalink
- Report Inappropriate Content
For all people with similar problems:
I finally solved the problem that I didn't want to show [Cost of Sales] by creating variables with the expressions David suggested and use these variables for further calculations. ![]() Now I don't have to hide anything!
Now I don't have to hide anything!
- Mark as New
- Bookmark
- Subscribe
- Mute
- Subscribe to RSS Feed
- Permalink
- Report Inappropriate Content
Thank you for the above reply. It helps when i have the numeric data in a single field.
My problem is similar to the one mentioned at the start of this thread, with the exception that i have data in multiple fields. that means, my each month data is in separate fields named JAN, FEB, MAR, etc. a sample data is given below. Can you help me to add Gross Profit and Gross Profit% to this in the pivot table?

Your help in this will be highly appreciated.
Thanks.....Abraham