Unlock a world of possibilities! Login now and discover the exclusive benefits awaiting you.
- Qlik Community
- :
- All Forums
- :
- QlikView App Dev
- :
- Pivot Table Behavior With Pick and Aggr Functions
- Subscribe to RSS Feed
- Mark Topic as New
- Mark Topic as Read
- Float this Topic for Current User
- Bookmark
- Subscribe
- Mute
- Printer Friendly Page
- Mark as New
- Bookmark
- Subscribe
- Mute
- Subscribe to RSS Feed
- Permalink
- Report Inappropriate Content
Pivot Table Behavior With Pick and Aggr Functions
I'm creating a pivot table that is a pretty standard format that we use all time in my company. It looks like this:
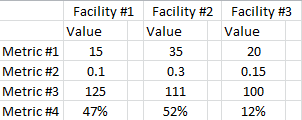
I get this by having 2 dimensions (Metric and Facility) and 2 Expressions (A Pick to calculate each Metric:
Pick(Match(MetricNumber,02,04,06,08,10,12,14) ,$(Metric#1) ,$(Metric#2) ,$(Metric#3), $(Metric#4))
and a blank column for formatting reasons - the expression is just ' ')
The metric names are loaded via Inline table:
Metrics:
LOAD * INLINE [
Metric, MetricNumber
Metric #1, 02
Metric #2, 04
Metric #3, 06
Metric #4, 08
];
I wanted to add more content in the form of up or down color-coded arrows based on trending. I decided to add a trending arrow to replace the blank column that would calculate the slope a line fit to the last 6 months of data. I came up with this that seemed to work (no set for date range yet)
LINEST_M(Aggr($(Metric #1),Facility,[Transaction Date]),[Transaction Date])
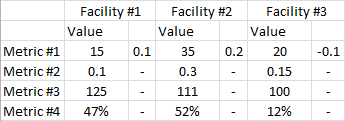
A curious thing happened when I added it to my pivot table. Here is my Pick for the expression:
=Pick(Match(MetricNumber,02,04,06,08)
,LINEST_M(Aggr($(Metric #1),Facility,[Transaction Date]),[Transaction Date])
,LINEST_M(Aggr($(Metric #2),Facility,[Transaction Date]),[Transaction Date])
,LINEST_M(Aggr($(Metric #3),Facility,[Transaction Date]),[Transaction Date])
,LINEST_M(Aggr($(Metric #4),Facility,[Transaction Date]),[Transaction Date]))
I get the calculated slope for the first metric, but not any of the other metrics. I get the '-'
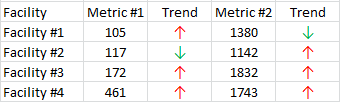
Anyone else have this problem or know what is causing this ? It seems to be related to using Aggr with a Pick function but I'm not sure. If I flip the axis on the Facility and the Metric and put a separate expressions in for each metric/trend it seems to work fine. This does not require the use of Pick since each metric has its' own expression:
- Mark as New
- Bookmark
- Subscribe
- Mute
- Subscribe to RSS Feed
- Permalink
- Report Inappropriate Content
This may totally not work, but can you try using the aggregate function without Facility in it?
=Pick(Match(MetricNumber,02,04,06,08)
,LINEST_M(Aggr($(Metric #1),[Transaction Date]),[Transaction Date])
,LINEST_M(Aggr($(Metric #2),[Transaction Date]),[Transaction Date])
,LINEST_M(Aggr($(Metric #3),[Transaction Date]),[Transaction Date])
,LINEST_M(Aggr($(Metric #4),[Transaction Date]),[Transaction Date]))
If this doesn't work, can you add Metric (your 1st dimension) to your aggregation (as far as I understand, this should work)
=Pick(Match(MetricNumber,02,04,06,08)
,LINEST_M(Aggr($(Metric #1),Metric, Facility,[Transaction Date]),[Transaction Date])
,LINEST_M(Aggr($(Metric #2),Metric, Facility,[Transaction Date]),[Transaction Date])
,LINEST_M(Aggr($(Metric #3),Metric, Facility,[Transaction Date]),[Transaction Date])
,LINEST_M(Aggr($(Metric #4),Metric, Facility,[Transaction Date]),[Transaction Date]))
Let me know the outputs.
Best,
S