Unlock a world of possibilities! Login now and discover the exclusive benefits awaiting you.
- Qlik Community
- :
- All Forums
- :
- QlikView
- :
- Pivot Table : conditionally showing expression
- Subscribe to RSS Feed
- Mark Topic as New
- Mark Topic as Read
- Float this Topic for Current User
- Bookmark
- Subscribe
- Mute
- Printer Friendly Page
- Mark as New
- Bookmark
- Subscribe
- Mute
- Subscribe to RSS Feed
- Permalink
- Report Inappropriate Content
Pivot Table : conditionally showing expression
Hello All,
I have a pivot table with 4 dimension and 6 expressions, I want to conditionally show metrics\expressions under the dimension. So in below screenshot all metrics are visible, but the requirement is to show Metric 1 for Category as H and L while Metric 2 when category in only L while Metric 4 should be visible only when Category is L and M.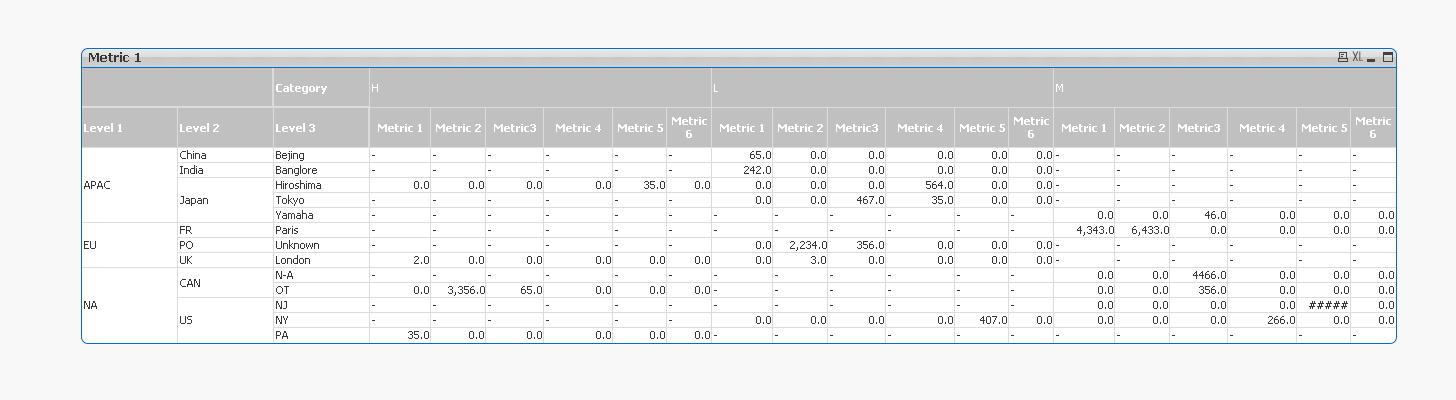
I tried conditional in expressions tab its not working .
- Mark as New
- Bookmark
- Subscribe
- Mute
- Subscribe to RSS Feed
- Permalink
- Report Inappropriate Content
The conditional on expression tab works globally for the chart, not per (any) dimensional value.
The only solution I can see is creating an artificial dimension that is linked to certain dimensional value combinations only, and then create a single expression that branches into several expressions based on that artificial dimension value.
There are some examples here in the forum how you can do that.
- Mark as New
- Bookmark
- Subscribe
- Mute
- Subscribe to RSS Feed
- Permalink
- Report Inappropriate Content
Hi Sanketh,
I'm still working on your sample. But up to now how about something like this,
1. Create 3 charts on top one another and use Category in the set analysis expression. (For category H there will e only expressions you need, for other categories as well)
2. Set the visibility and movability based on your selection to make it working fine.
Rgds,
Tharindu
- Mark as New
- Bookmark
- Subscribe
- Mute
- Subscribe to RSS Feed
- Permalink
- Report Inappropriate Content
Hello,
I tried something and...hope this is what you are looking for. I can't figure out how to put the app here but i'll put the code.
For metric 1, click conditional : if(match(GetFieldSelections(Category),'H, L'),1,0);
For metric 2, click conditional: Category='L';
For metric 4, click conditional : if(match(GetFieldSelections(Category),'L, M'),1,0) .
Hope it helps!
Thanks,
Andrei