Unlock a world of possibilities! Login now and discover the exclusive benefits awaiting you.
- Qlik Community
- :
- All Forums
- :
- QlikView App Dev
- :
- Pivot expand problem
- Subscribe to RSS Feed
- Mark Topic as New
- Mark Topic as Read
- Float this Topic for Current User
- Bookmark
- Subscribe
- Mute
- Printer Friendly Page
- Mark as New
- Bookmark
- Subscribe
- Mute
- Subscribe to RSS Feed
- Permalink
- Report Inappropriate Content
Pivot expand problem
Hi ALL,
I have the following problem.
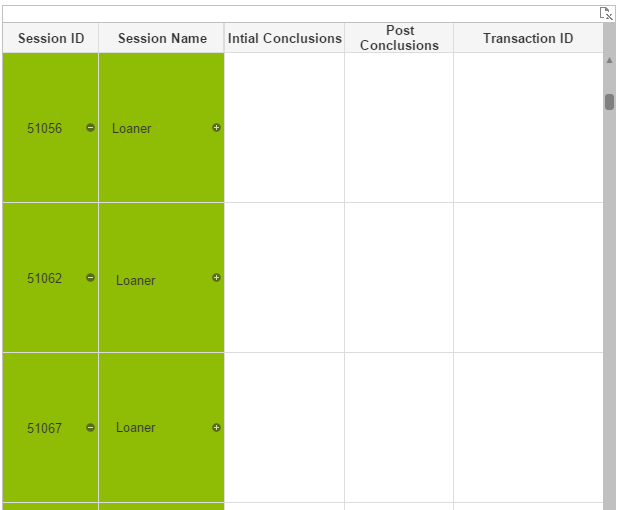
I have a pivot table with colors background in every dimensions.
when the pivot is collapse, the table looks like the following:
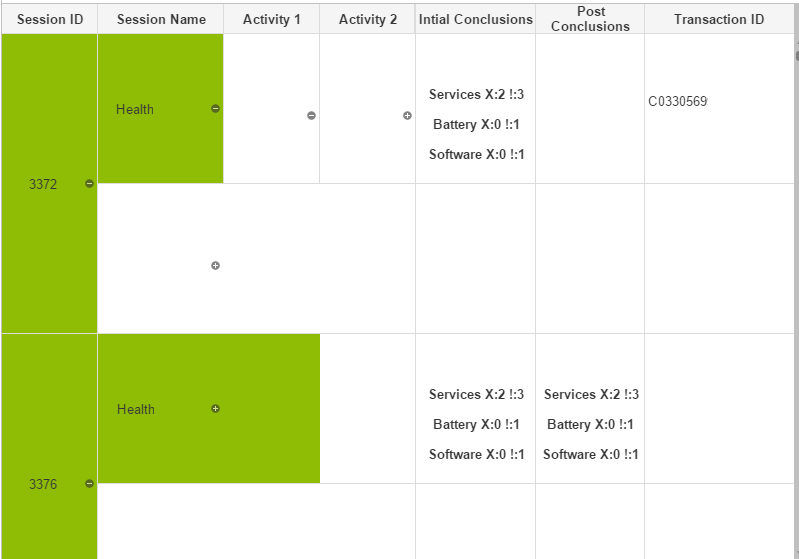
when I open the second dimension, I can see the colors of all the column although I want to see only the color of the specific row I expanded
Can someone please advise? Hope I was clear enough
Accepted Solutions
- Mark as New
- Bookmark
- Subscribe
- Mute
- Subscribe to RSS Feed
- Permalink
- Report Inappropriate Content
Now I get it. It seems as if the Activity 1 area, whenever collapsed, gets the color of the first actual Activity 1 dimension value.
You can use the dimensionality() function to decide whether a dimension cell should be colored or not. See the QV Desktop help (Chart Inter Record Functions->dimensionality()) which explicitly states that "A typical use is in attribute expressions, when you want to apply different cell formatting depending on aggregation level of data."
- Mark as New
- Bookmark
- Subscribe
- Mute
- Subscribe to RSS Feed
- Permalink
- Report Inappropriate Content
Both selections (3372 & 3376) are expanded, it seems...
- Mark as New
- Bookmark
- Subscribe
- Mute
- Subscribe to RSS Feed
- Permalink
- Report Inappropriate Content
only the first dimension, the second dimension is not
- Mark as New
- Bookmark
- Subscribe
- Mute
- Subscribe to RSS Feed
- Permalink
- Report Inappropriate Content
I'm sorry, I'm not following you.
What should be colored differently in your second screenshot?
- Mark as New
- Bookmark
- Subscribe
- Mute
- Subscribe to RSS Feed
- Permalink
- Report Inappropriate Content
the activity 1 field under 3376 shouldn't be white because I didn't expand the "session name" dimension of that row?
- Mark as New
- Bookmark
- Subscribe
- Mute
- Subscribe to RSS Feed
- Permalink
- Report Inappropriate Content
There is no Activity 1 area for 3376->Health. The Session Name field covers two cells and the double cell is green.
[Edit] Wasn't precise enough. Better now.
- Mark as New
- Bookmark
- Subscribe
- Mute
- Subscribe to RSS Feed
- Permalink
- Report Inappropriate Content
thanks for answering.
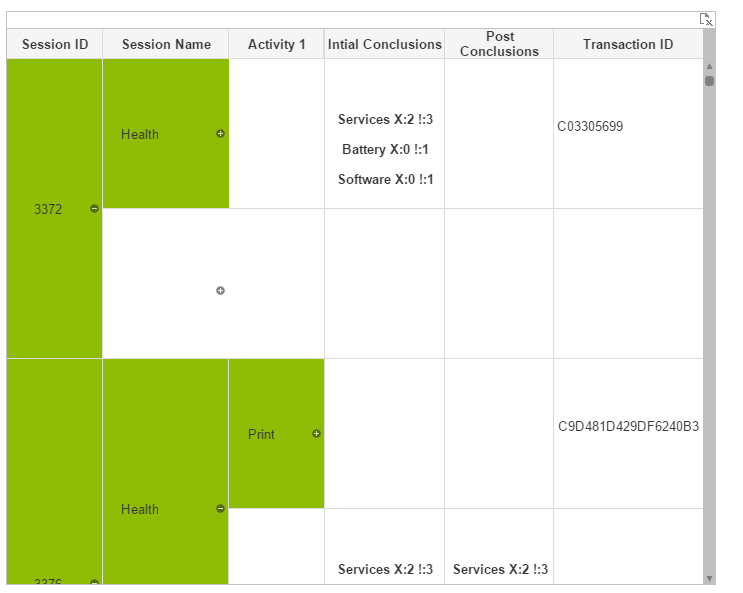
that's not true. you can see in the attached screenshot that this field contain activity 1 after expanding it.
- Mark as New
- Bookmark
- Subscribe
- Mute
- Subscribe to RSS Feed
- Permalink
- Report Inappropriate Content
Now I get it. It seems as if the Activity 1 area, whenever collapsed, gets the color of the first actual Activity 1 dimension value.
You can use the dimensionality() function to decide whether a dimension cell should be colored or not. See the QV Desktop help (Chart Inter Record Functions->dimensionality()) which explicitly states that "A typical use is in attribute expressions, when you want to apply different cell formatting depending on aggregation level of data."
- Mark as New
- Bookmark
- Subscribe
- Mute
- Subscribe to RSS Feed
- Permalink
- Report Inappropriate Content
Thank you!