Unlock a world of possibilities! Login now and discover the exclusive benefits awaiting you.
- Qlik Community
- :
- All Forums
- :
- QlikView App Dev
- :
- Pivot issue
- Subscribe to RSS Feed
- Mark Topic as New
- Mark Topic as Read
- Float this Topic for Current User
- Bookmark
- Subscribe
- Mute
- Printer Friendly Page
- Mark as New
- Bookmark
- Subscribe
- Mute
- Subscribe to RSS Feed
- Permalink
- Report Inappropriate Content
Pivot issue
I have an issue with a pivot I just did (Im a newbie at qlikview)
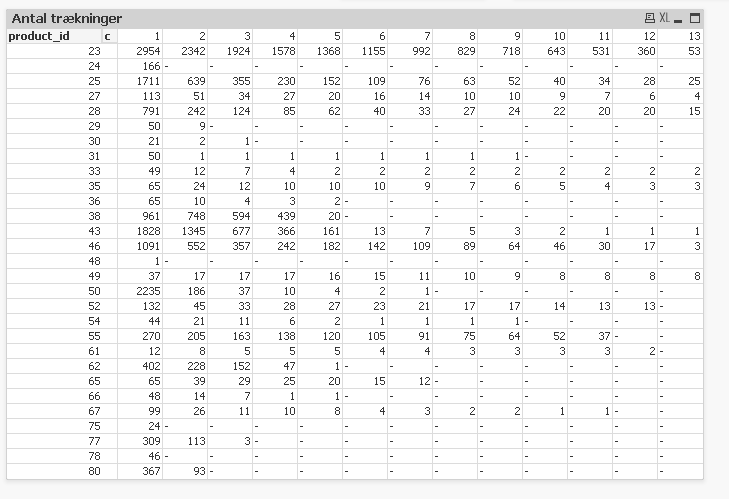
I just did this pivot that shows the subscription renewal count for each of our products. Now at the end (next to 13) I want to add the average count for each product and maybe also the average customer lifetime value(it should be average count * product price).
But How do I add that at the end of the pivot?
- « Previous Replies
-
- 1
- 2
- Next Replies »
Accepted Solutions
- Mark as New
- Bookmark
- Subscribe
- Mute
- Subscribe to RSS Feed
- Permalink
- Report Inappropriate Content
So maybe
=if(SecondaryDimensionality()=0,
sum(aggr( count*count(count),product_id,count)) / sum( aggr( count(count), product_id,count)),
count(count))
[And please try to format your total results in number tab, currently it's quite hard to check if the results are ok.]
- Mark as New
- Bookmark
- Subscribe
- Mute
- Subscribe to RSS Feed
- Permalink
- Report Inappropriate Content
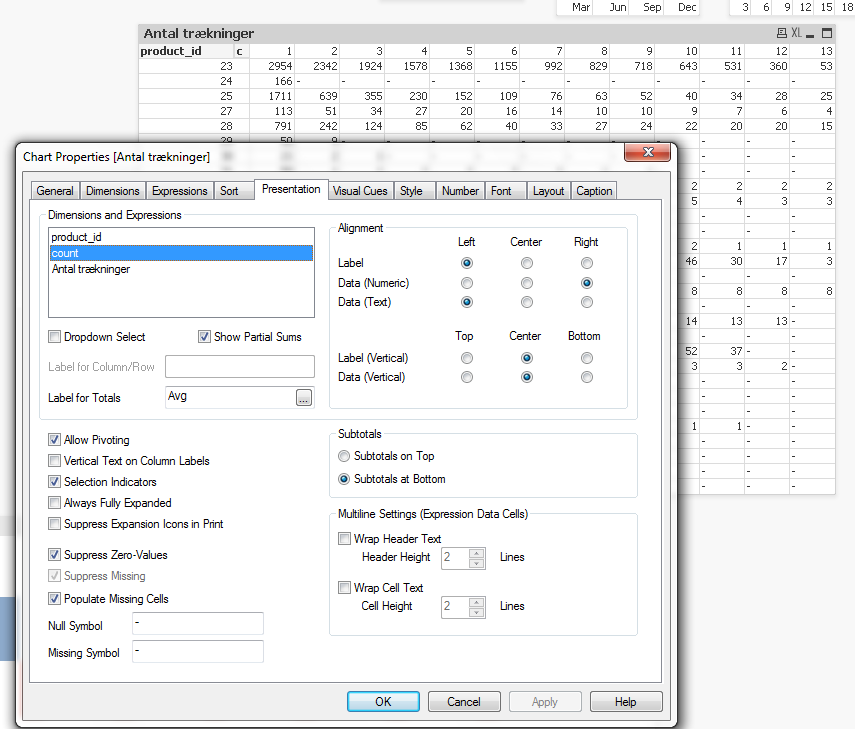
You can enable a partial sum for you second dimension in presentation tab of your chart properties, the use as expression something like
=if(SecondaryDimensionality()=0,avg(aggr( count(FIELD),product_id,c)),count(FIELD))
i.e. use secondarydimensionalty() function to check if your in a cell or the total column, then use an appropriate expression (in my example, you need to replace the aggr() dimensions with your chart dimensions and FIELD with the field you are counting on.
Hope this helps,
Stefan
- Mark as New
- Bookmark
- Subscribe
- Mute
- Subscribe to RSS Feed
- Permalink
- Report Inappropriate Content
I dont understand what I need to replace "aggr()" with?
- Mark as New
- Bookmark
- Subscribe
- Mute
- Subscribe to RSS Feed
- Permalink
- Report Inappropriate Content
No, you probably need the advanced aggregation (to average the counts per your second dimension).
I intened to say that you need to reuse your pivot table chart dimensions (product_id and c ?) also as dimensions in your aggr() function. So if your field names you are using as dimension in the pivot table are product_id and c, you don't need to change the aggr() dimensions. Just replace count(FIELD) with the expression you are using to calculate the counts. in your table.
- Mark as New
- Bookmark
- Subscribe
- Mute
- Subscribe to RSS Feed
- Permalink
- Report Inappropriate Content
I Tried to add "=if(SecondaryDimensionality()=0,avg(aggr( count(count),product_id,c)),count(count)) in the "Label for Totals" under partial sums, but nothing really happened - it still showing the total numbers.
(Count is the name of the field)
- Mark as New
- Bookmark
- Subscribe
- Mute
- Subscribe to RSS Feed
- Permalink
- Report Inappropriate Content
I assume you are currently using one expression (defined in expression tab) to calculate your cell values in your pivot table.
As I understood, this expression is
=count(count)
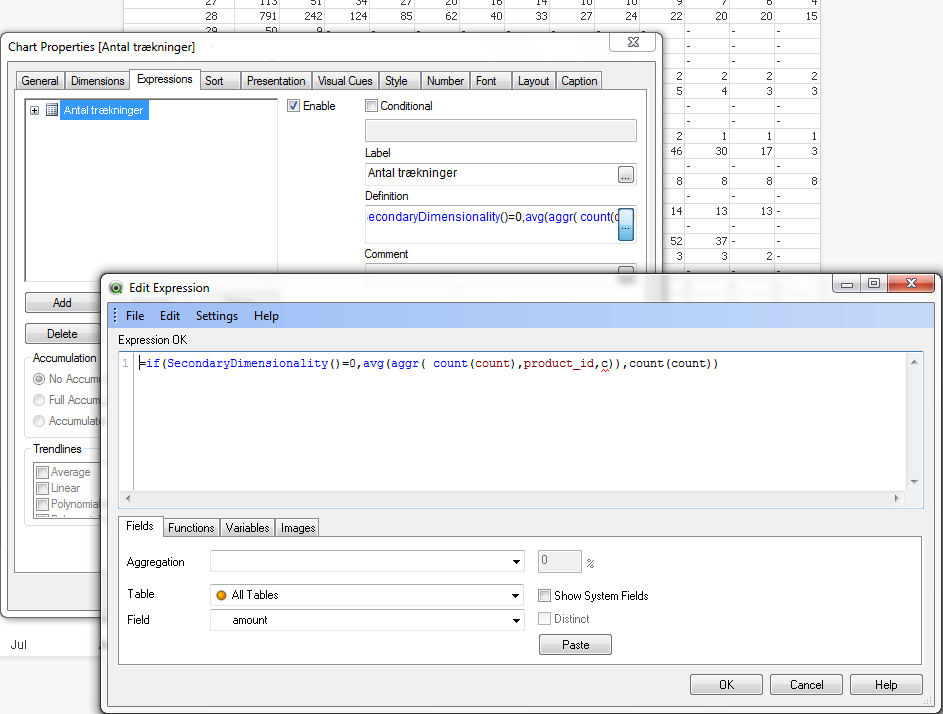
Replace this expression by
=if(SecondaryDimensionality()=0,avg(aggr( count(count),product_id,c)),count(count))
And don't forget to enable the partial sum for your second dimension.
The secondarydimensionality() is used for dimensions dragged to the top (as in your sample image). Use dimensionality() if you are using vertical dimensions.
- Mark as New
- Bookmark
- Subscribe
- Mute
- Subscribe to RSS Feed
- Permalink
- Report Inappropriate Content
Ohh Thank you! - I tried to change the expression, but the only thing which happened were that totals columns disappeared
- Mark as New
- Bookmark
- Subscribe
- Mute
- Subscribe to RSS Feed
- Permalink
- Report Inappropriate Content
Ok, so your second dimension is not called 'c' but 'count', right?
Please check my above posts and correct the second dimension in the aggr() function from 'c' to 'count':
=if(SecondaryDimensionality()=0,avg(aggr( count(count),product_id,count)),count(count))
- Mark as New
- Bookmark
- Subscribe
- Mute
- Subscribe to RSS Feed
- Permalink
- Report Inappropriate Content
Got it to work - Thank you swuehl!
But I noticed it calculates the wrong average:
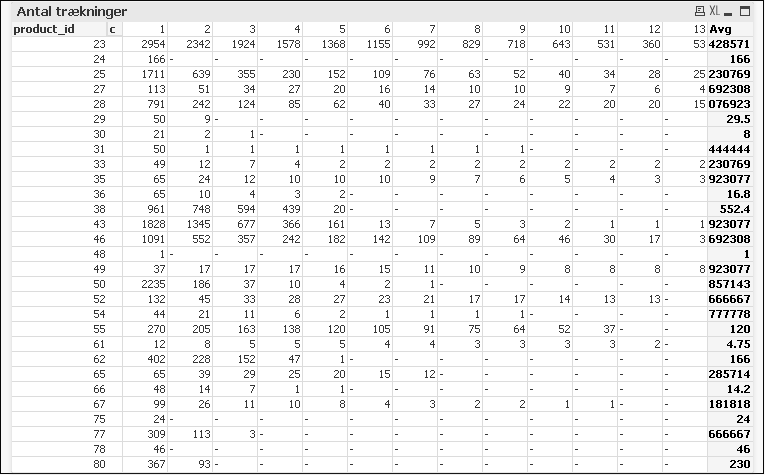
And I dont really understand how to change it?
What I would like to calculate is that average subscription count for a product_id:
For product_id 23 it should calculate:
=((2954*1)+(2342*2)+(1924*3)+(1578*4)+(1368*5)+(1155*6)+(992*7)+(829*8)+(718*9)+(643*10)+(531*11)+(360*12)+(53*13)) / (2954+2342+1924+1578+1368+1155+992+829+718+643+531+360+53)
Average count = 4,6
- Mark as New
- Bookmark
- Subscribe
- Mute
- Subscribe to RSS Feed
- Permalink
- Report Inappropriate Content
So maybe
=if(SecondaryDimensionality()=0,
sum(aggr( count*count(count),product_id,count)) / sum( aggr( count(count), product_id,count)),
count(count))
[And please try to format your total results in number tab, currently it's quite hard to check if the results are ok.]
- « Previous Replies
-
- 1
- 2
- Next Replies »