Unlock a world of possibilities! Login now and discover the exclusive benefits awaiting you.
- Qlik Community
- :
- All Forums
- :
- QlikView App Dev
- :
- Pivot table Calculation
- Subscribe to RSS Feed
- Mark Topic as New
- Mark Topic as Read
- Float this Topic for Current User
- Bookmark
- Subscribe
- Mute
- Printer Friendly Page
- Mark as New
- Bookmark
- Subscribe
- Mute
- Subscribe to RSS Feed
- Permalink
- Report Inappropriate Content
Pivot table Calculation
This is the structure of the table
| Row Labels | Sum of Sales | Sum of Revenue |
| 2015 | 38000 | 24700 |
| Q3 | 24000 | 15600 |
| Jul | 8000 | 5200 |
| Aug | 7000 | 4550 |
| Sep | 9000 | 5850 |
| Q4 | 14000 | 9100 |
| Oct | 2000 | 1300 |
| Nov | 5000 | 3250 |
| Dec | 7000 | 4550 |
| 2016 | 58000 | 37700 |
| Q1 | 14000 | 9100 |
| Jan | 9000 | 5850 |
| Feb | 4000 | 2600 |
| Mar | 1000 | 650 |
| Q2 | 17000 | 11050 |
| Apr | 5000 | 3250 |
| May | 5000 | 3250 |
| Jun | 7000 | 4550 |
| Q3 | 27000 | 17550 |
| Jul | 8000 | 5200 |
| Aug | 9000 | 5850 |
| Sep | 10000 | 6500 |
| Grand Total | 96000 | 62400 |
In QV I need to design the same table with an additional calculated measure where i need to display the ratio at the month level against the total at the quarter level. For eg: 2015-Q3-Jul-8000(Sales) should be compared against 2015-Q3 total of 24000,ie.. 33%.
At the quarter level and the year level the above calculation has to be ignored.
How to achieve this ?
Accepted Solutions
- Mark as New
- Bookmark
- Subscribe
- Mute
- Subscribe to RSS Feed
- Permalink
- Report Inappropriate Content
Is this what you are looking for?
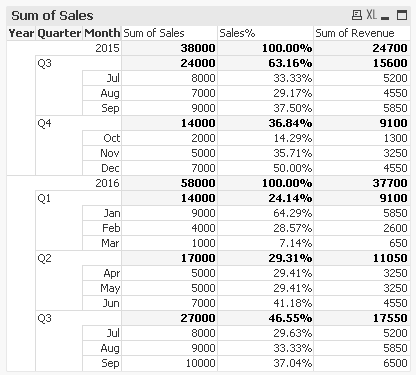
Expression:
=If(Dimensionality() = 3, Sum(Sales)/Sum(TOTAL <Quarter, Year> Sales), Sum(Sales)/Sum(TOTAL <Year> Sales))
- Mark as New
- Bookmark
- Subscribe
- Mute
- Subscribe to RSS Feed
- Permalink
- Report Inappropriate Content
Try with
Sum(Sales) / Sum(aggr(Sales, Quarter))
let me know
- Mark as New
- Bookmark
- Subscribe
- Mute
- Subscribe to RSS Feed
- Permalink
- Report Inappropriate Content
Is this what you are looking for?
Expression:
=If(Dimensionality() = 3, Sum(Sales)/Sum(TOTAL <Quarter, Year> Sales), Sum(Sales)/Sum(TOTAL <Year> Sales))
- Mark as New
- Bookmark
- Subscribe
- Mute
- Subscribe to RSS Feed
- Permalink
- Report Inappropriate Content
Yes Sunny, this is what I am looking for.
This works. Thank you