Unlock a world of possibilities! Login now and discover the exclusive benefits awaiting you.
- Qlik Community
- :
- All Forums
- :
- QlikView App Dev
- :
- Pivot table Problem
- Subscribe to RSS Feed
- Mark Topic as New
- Mark Topic as Read
- Float this Topic for Current User
- Bookmark
- Subscribe
- Mute
- Printer Friendly Page
- Mark as New
- Bookmark
- Subscribe
- Mute
- Subscribe to RSS Feed
- Permalink
- Report Inappropriate Content
Pivot table Problem
Hi Everyone,
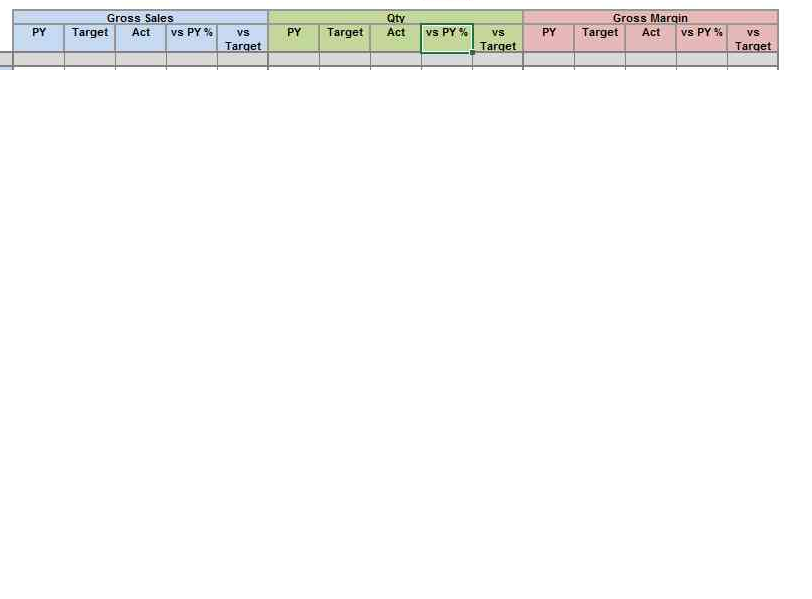
Here i'm not getting that how to show the report in this type of format in Pivot table.. the format is as below-
I want to show on the top Gross Sales in one column. In Gross Sales column we want to show the different five column
PY , Target, Act , vs PY% and PY. as in the below fig . I am unable to do this .
Please anyone help me how to do these things.
- Mark as New
- Bookmark
- Subscribe
- Mute
- Subscribe to RSS Feed
- Permalink
- Report Inappropriate Content
Hi Manoj,
Are Gross Sales, Qty, and Gross Margin all in the same dimension (or field)?
If so, then just drag and drop that dimension on top of your expressions (horizontally).
Regards.
- Mark as New
- Bookmark
- Subscribe
- Mute
- Subscribe to RSS Feed
- Permalink
- Report Inappropriate Content
Hi,
You can use Pivoting to do this.
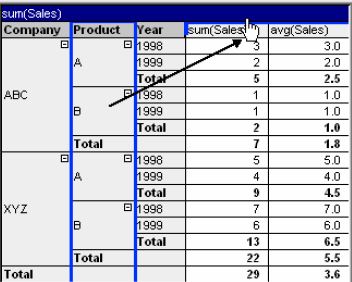
Press the left mouse button and keep it depressed while dragging the mouse cursor up above the expression label row.
For using this, make sure that Allow Pivoting option is enabled in Presentation tab.
I hope this help you
Regards,
Ashutosh
- Mark as New
- Bookmark
- Subscribe
- Mute
- Subscribe to RSS Feed
- Permalink
- Report Inappropriate Content
See this link, might help you: Merge headers in pivot table