Unlock a world of possibilities! Login now and discover the exclusive benefits awaiting you.
- Qlik Community
- :
- All Forums
- :
- QlikView App Dev
- :
- Pivot table expression selector with inline table
- Subscribe to RSS Feed
- Mark Topic as New
- Mark Topic as Read
- Float this Topic for Current User
- Bookmark
- Subscribe
- Mute
- Printer Friendly Page
- Mark as New
- Bookmark
- Subscribe
- Mute
- Subscribe to RSS Feed
- Permalink
- Report Inappropriate Content
Pivot table expression selector with inline table
Hi there,
I'm trying to improve the performance of a QlikView application on a table chart where there are to many conditional expressions. To do that I'm tring to create an Inline table with the expressions on it, so that they could consider the expressions directly from it.
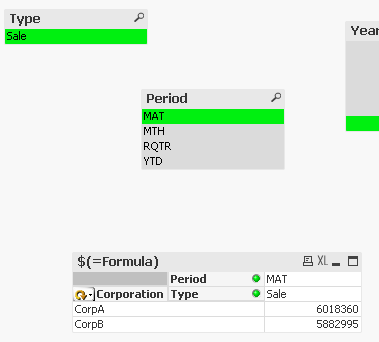
My issue is that the expressions doesn't work unless I select the field corresponding to it, as follows:
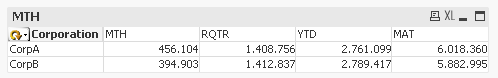
This is what I want to see:
And this is what I get:
My idea is to use the inline table to separate each KPI into period blocks, to reduce the number of conditionals currently being used in the original application. Where today I have "Sale", I'll also have "Growth", "Share", etc., each one below its respective Period (Sale MTH, Sale RQTR, Sale YTD, Sale MAT and so on):
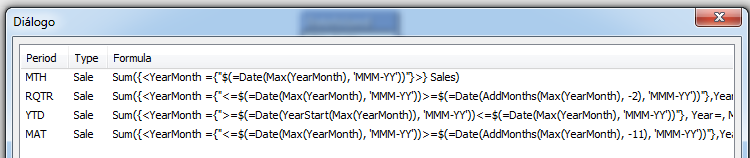
Following attached is the xls and qvw I used to create this example.
Thanks in advance! 