Unlock a world of possibilities! Login now and discover the exclusive benefits awaiting you.
- Qlik Community
- :
- All Forums
- :
- QlikView App Dev
- :
- Pivot table label missing for expression
- Subscribe to RSS Feed
- Mark Topic as New
- Mark Topic as Read
- Float this Topic for Current User
- Bookmark
- Subscribe
- Mute
- Printer Friendly Page
- Mark as New
- Bookmark
- Subscribe
- Mute
- Subscribe to RSS Feed
- Permalink
- Report Inappropriate Content
Pivot table label missing for expression
Dear Gurus,
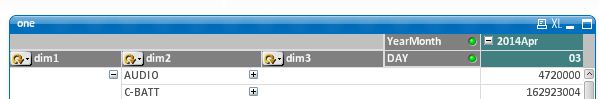
I have made a pivot table with one expression and 5 dimensions. out of 5 dimensions i brought 2 dimensions as columns. Then my Expression label is missing.
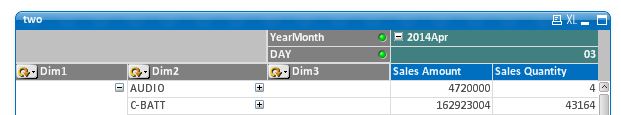
If I do the same with 2 expressions(clacualtions) I can see labels.
Pls let me know how can I see the label if I have only one expression. Is it a limitation?
Please see the screenshots.
BR,
Neeru
- Tags:
- new-to-qlikview
- Mark as New
- Bookmark
- Subscribe
- Mute
- Subscribe to RSS Feed
- Permalink
- Report Inappropriate Content
can you post a sample app? Not happening for me.
- Mark as New
- Bookmark
- Subscribe
- Mute
- Subscribe to RSS Feed
- Permalink
- Report Inappropriate Content
Hi,
PFA Sample app and data.
BR,
Neeru
- Mark as New
- Bookmark
- Subscribe
- Mute
- Subscribe to RSS Feed
- Permalink
- Report Inappropriate Content
Does any one has the solution for this issue? pls help
- Mark as New
- Bookmark
- Subscribe
- Mute
- Subscribe to RSS Feed
- Permalink
- Report Inappropriate Content
The only thing I came up with is creating a dummy 2nd expression and setting the width to 0 so it does not show. You will need a macro to set the width to zero.
But why is it so important? Since it is one expression, you can put the description in the charts caption.
- Mark as New
- Bookmark
- Subscribe
- Mute
- Subscribe to RSS Feed
- Permalink
- Report Inappropriate Content
Hi Jonnis,
My expressions are dynamic based on user selection(in List Box) I will show only one expression at a time.
I tried with the second dummy expression early but wasn't able to hide it.
Kindly share the macro to set width to 0 of my dummy expression.
BR,
Neeru
- Mark as New
- Bookmark
- Subscribe
- Mute
- Subscribe to RSS Feed
- Permalink
- Report Inappropriate Content
- Mark as New
- Bookmark
- Subscribe
- Mute
- Subscribe to RSS Feed
- Permalink
- Report Inappropriate Content
Hi Neeru, not tested and I don't know how it will affect performance but you can try to add a calculated dimension after day, ie:
=$(=Chr(39) & SelectedExpressionField & Chr(39))